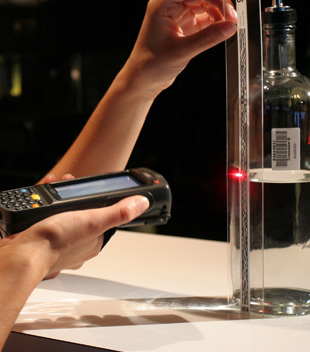
How to manage bar inventory that pays off
Plenty of venues take inventory. Far fewer manage it, in the sense that the count changes what they order, what they charge and who they talk to on Monday morning. This is the difference between the two.
Book a 15-minute demo See how it works
15 minutes, screen share, no install. A guided walkthrough of the software and straight answers on what it costs.
The four jobs of bar inventory management
- Count — establish what is on hand, accurately enough to subtract from.
- Cost — turn usage into a pour cost per product and per outlet.
- Order — buy from measured usage instead of from the gaps on the shelf.
- Investigate — chase the variance that is left, while it is still traceable.
Most operations do the first two and stop. The return is in the last two, and neither works on a count you do not believe.
Setting par levels that survive a busy weekend
Par is not the number you happen to keep. Build it from measured usage across several weeks, take the highest realistic week rather than the average, and add enough cover to get to your next delivery without a dry rail. Then revisit it when the menu changes, when a season turns, and after any event that emptied a product you did not expect.
Par built on estimates drifts upward, because nobody wants to run out. That drift is working capital sitting on a shelf.
Count cadence by venue type
- Nightclub or high-volume bar: weekly full count, daily spot check on premium spirits. Volume hides a great deal.
- Hotel with several outlets: weekly per outlet, so banquet activity does not mask a problem at the lobby bar.
- Restaurant with a modest bar: weekly if wine is a real part of the programme, otherwise every two weeks.
- Golf or country club: weekly in season, and pay attention to the halfway house and event bars, which are usually the least controlled.
Reading a variance report without drowning in it
Sort by dollar variance, not percentage variance, and work down the list. A twenty percent variance on a cheap mixer is noise; a four percent variance on your best-selling premium vodka is real money. Read three cuts of the same data: by outlet to find where, by period to find when, by product to work out what kind of problem it is.
One product short in one bar is behavioural. A whole category short across the property is usually receiving, breakage or an unrecorded transfer.
Ordering from usage instead of from memory
Ordering by looking at the shelf systematically over-buys what just sold out and under-buys what is quietly moving. Measured usage plus par gives you an order that reflects the period you just had. Over a year that is the difference between beverage stock as a working asset and beverage stock as a storeroom problem.
The shrinkage math that decides whether it was worth it
Do this with your own figures. Take your annual beverage purchases. Venues counting by estimate commonly lose 20 to 30 percent of that to over-pouring, unrecorded drinks, breakage and theft. Venues on a measured count typically run 1 to 3 percent. The gap between those two percentages, applied to your purchase figure, is the annual value of counting accurately.
Properties that make the change generally see beverage cost fall 25 to 50 percent within weeks, because the first trustworthy variance report tends to surface habits that had been invisible for years.
When a spreadsheet stops being enough
Three signs. You run more than one outlet and cannot compare them fairly. Partial bottles are a large share of your stock value and are all estimated. And your count and your POS disagree often enough that meetings are spent debating the count rather than acting on it.
Mistakes worth avoiding
Twenty-eight years of installations, condensed: counting too rarely to investigate anything; letting two people count the same bar differently; treating estimated partials as data; measuring the main bar but not the banquet and event bars; setting par once and never revisiting it; and producing a variance report that nobody is responsible for reading.
What operators say
Scannabar has saved us in excess of $15,000 per month.
Jan Harrold, Owner, The Club at Firestone, Orlando, Florida
We were very impressed with the accuracy of the system and the speed at which the inventory could be completed.
Murari Nambiar, Comptroller, Sailfish Club of Florida, Palm Beach, Florida
Questions operators ask
How often should we take bar inventory?
Weekly for a full count, daily for a spot check on your highest-cost spirits. Monthly is workable in a low-volume venue. Quarterly is bookkeeping, not management.
What is an acceptable bar variance?
Venues counting by estimate commonly see 20 to 30 percent shrinkage. With a measured count, 1 to 3 percent is the normal range, and anything above that is worth investigating rather than absorbing.
How do we set par levels?
Work from measured usage over several weeks rather than from memory, add cover for your busiest expected period, and review par whenever a menu or a season changes.
When does a spreadsheet stop being enough?
When you run more than one outlet, when partial bottles are a meaningful share of your stock value, or when you cannot reconcile a count against POS sales without a long argument about whether the count was right.
Do we need to change our POS?
No. Usage is imported by CSV, by XML, or through a direct API written to the POS vendor's published specification.
Book a 15-minute demo See how it works
15 minutes, screen share, no install. A guided walkthrough of the software and straight answers on what it costs.
Related: How to do a bar inventory count · Liquor monitoring system · Liquor inventory
Scannabar has measured beverage inventory for bars, hotels, clubs and restaurants since 1998. Head office: 2001 University Street, Suite 1700, Montréal, Québec H3A 2A6. Call 1-800-939-8960 or email sales@scannabar.com.