Expert Advice on Hospitality Topics

Liquor Inventory and Cost Control: A Complete Guide

Posted by Nick Kaoukis on Sun, Oct, 04, 2026 @ 13:10 PM
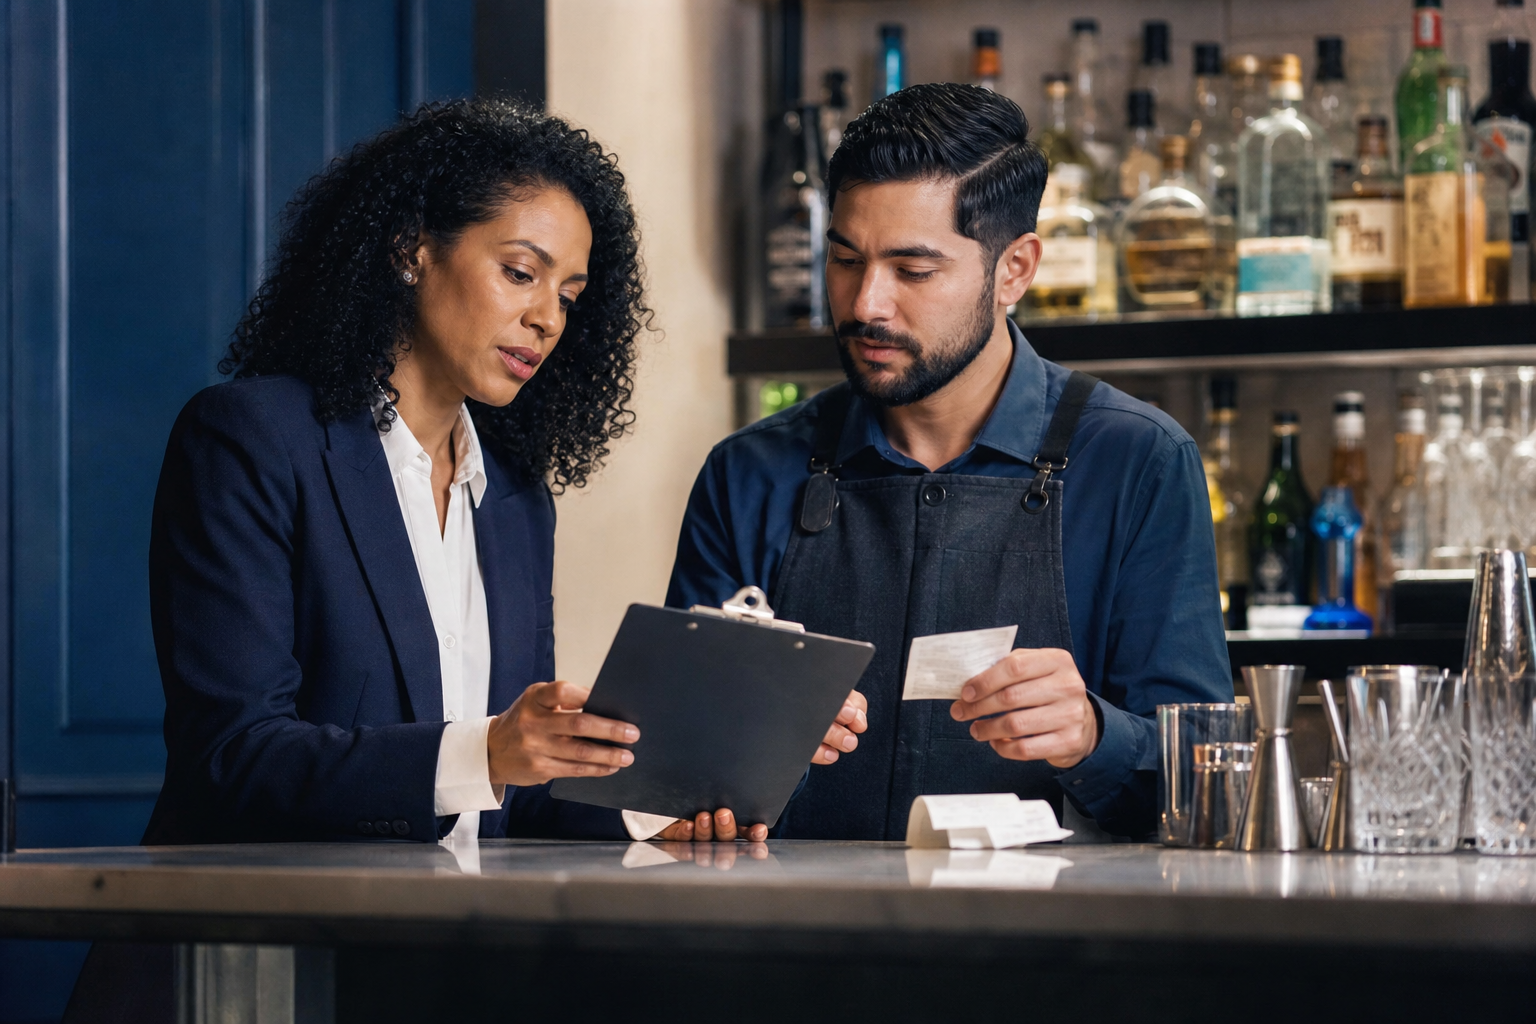
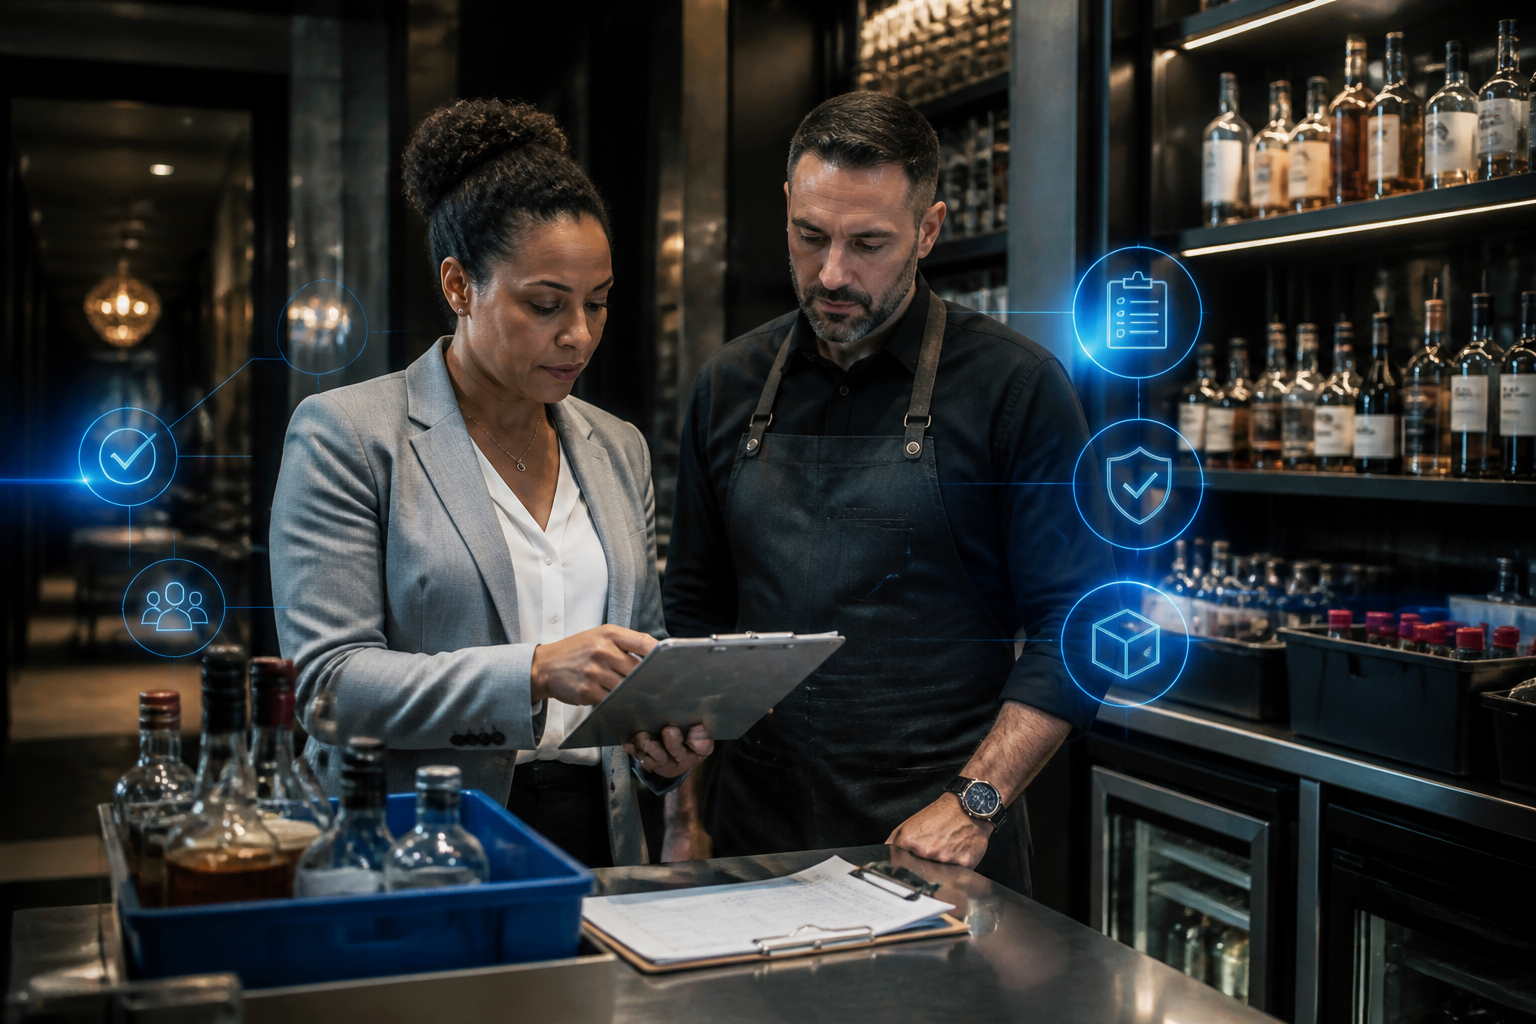
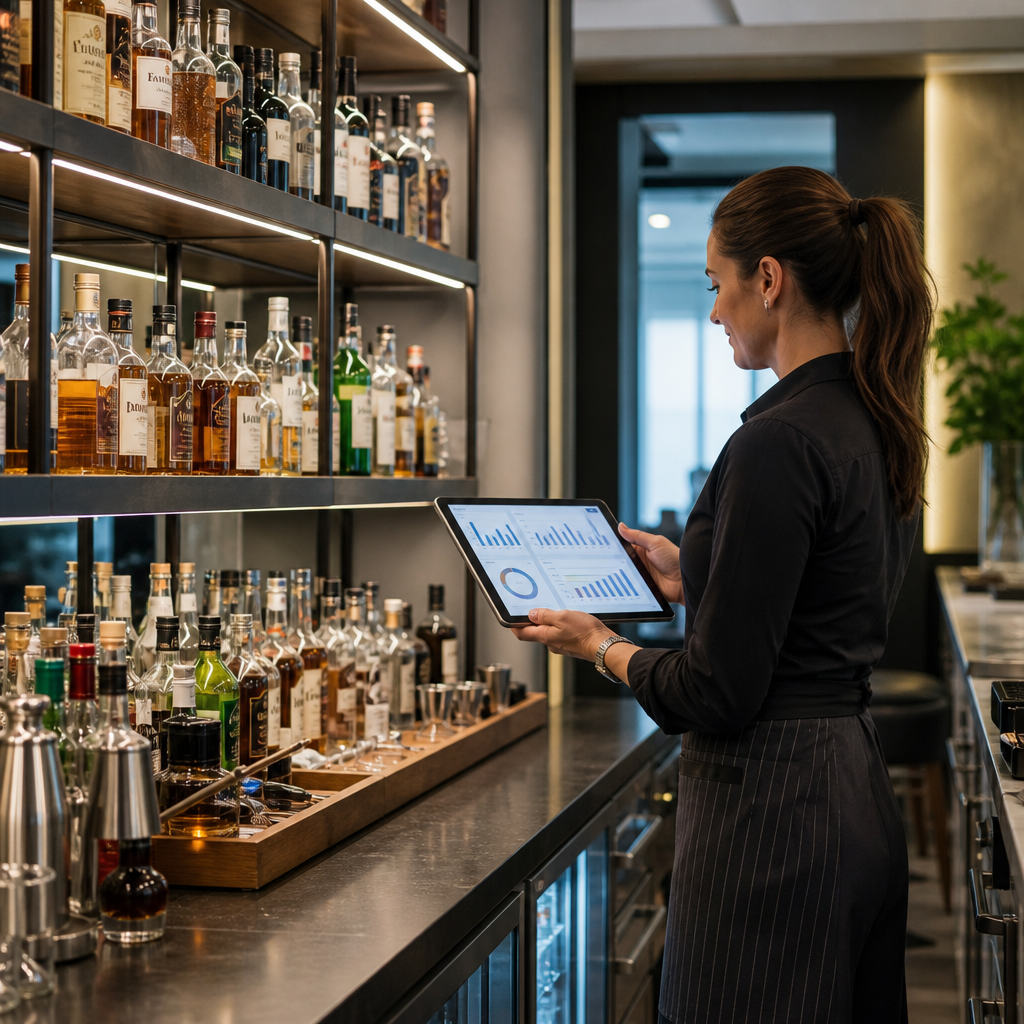
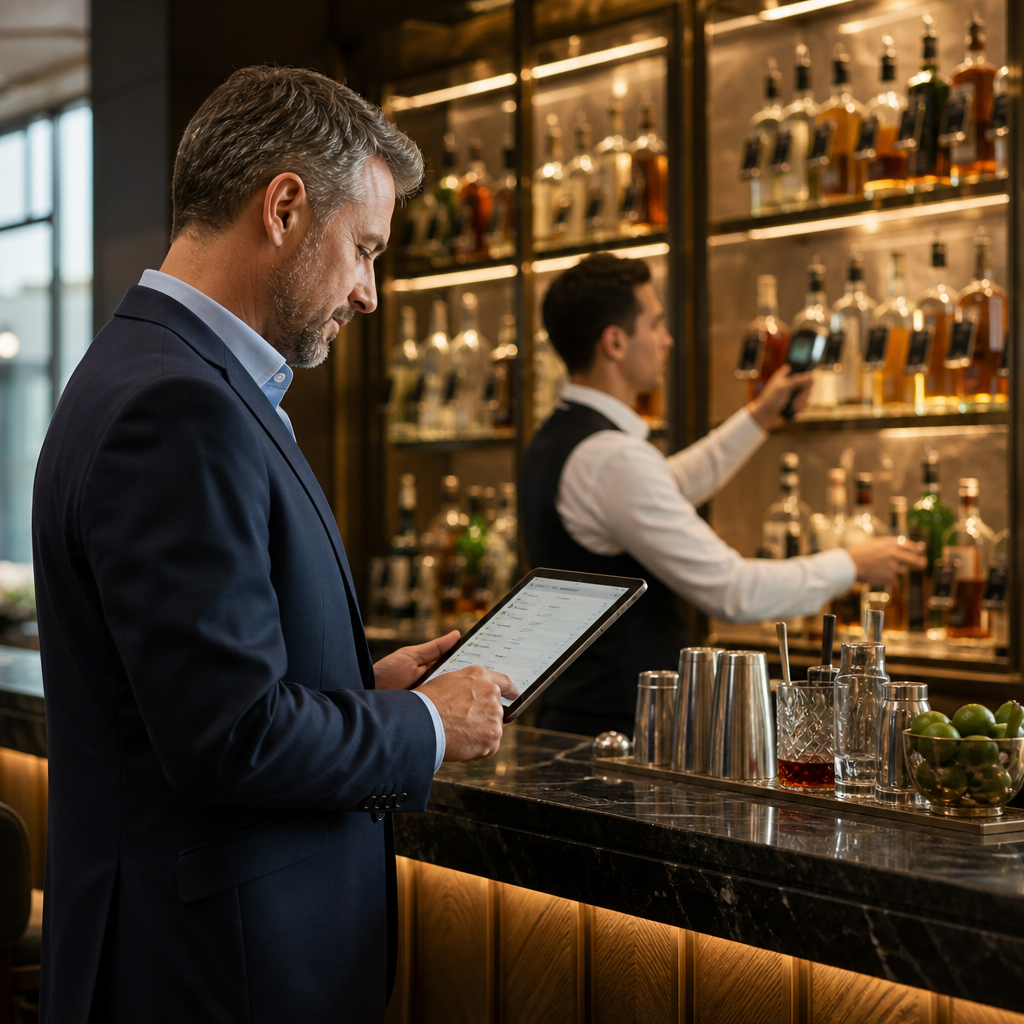
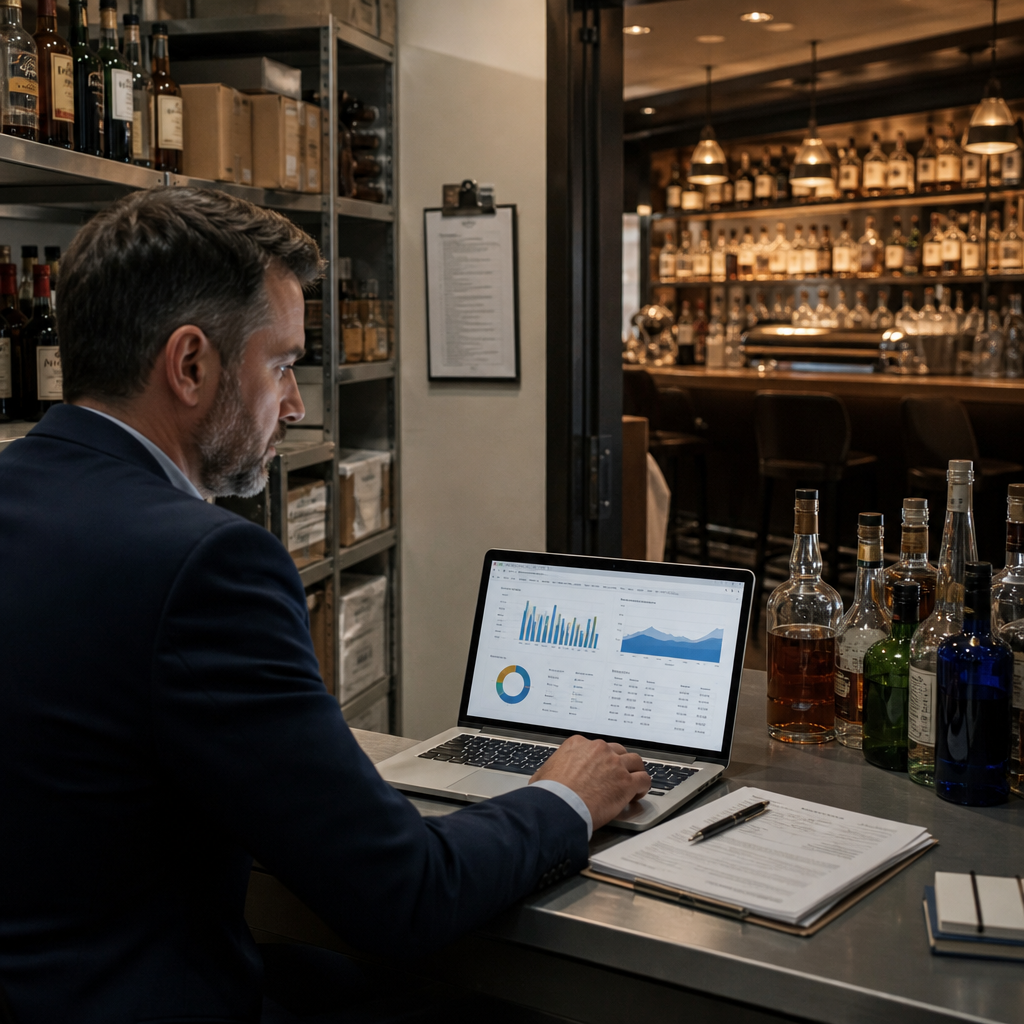
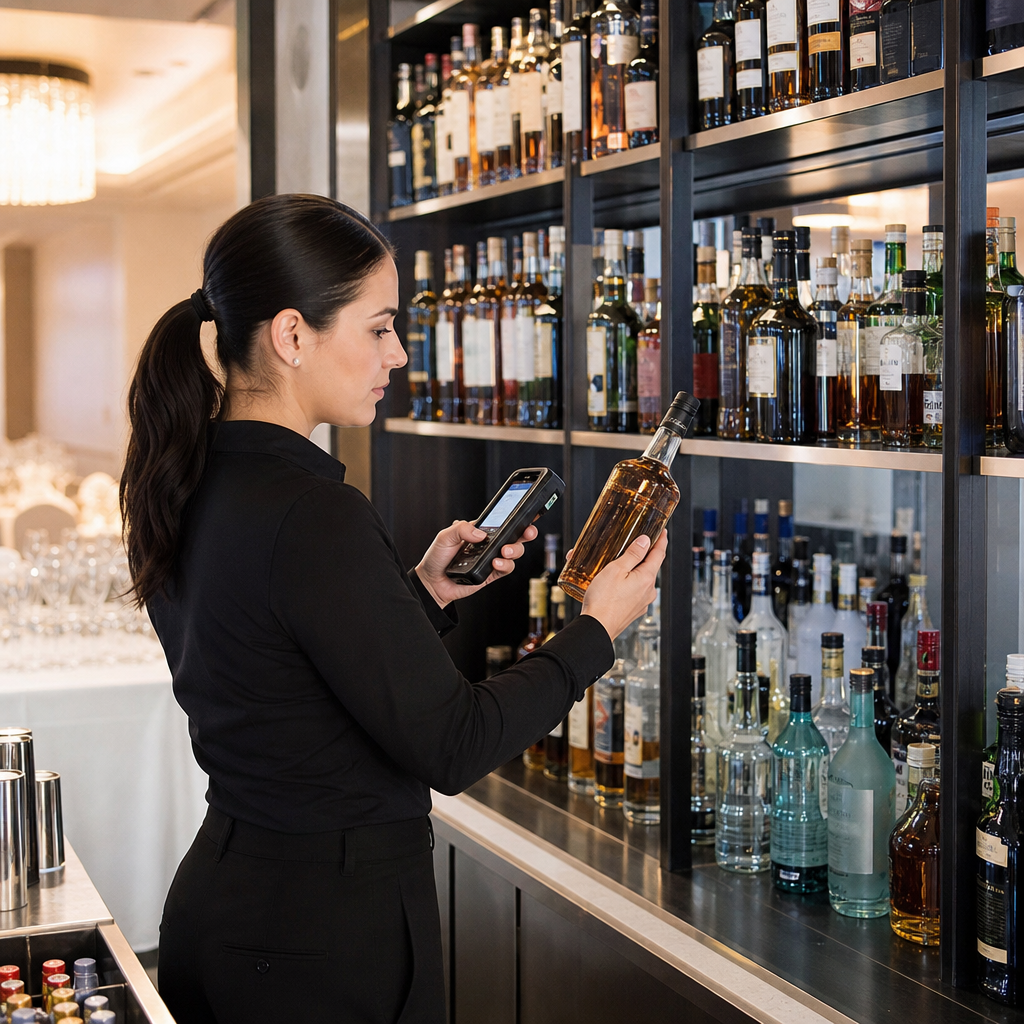
Hospitality manager reviewing organized liquor stock and inventory records before bar service
Illustrative AI-generated image of a bar inventory review.

Liquor inventory control connects stock counts, receiving records, transfers, recipes, and sales so you can understand what your beverage operation consumed and what that consumption cost. Cost control uses those records to guide pricing, purchasing, portion standards, and corrective action.

Scannabar supports liquor inventory control with barcode-enabled inventory measurement and usage reporting. This guide explains the operating process behind the reports, including how to calculate costs and investigate discrepancies without turning a number into an unsupported accusation.

Use the sections as a reference for your bar, restaurant, or hotel. The four companion articles provide deeper calculations and worksheet examples; this guide shows how their subjects fit together into a repeatable management routine.

Key Takeaways: Liquor Inventory and Cost Control

  • Reliable liquor inventory starts with documented receiving, stock movements, and consistent counts across every location included in your reporting scope.
  • Calculate liquor cost from inventory consumed and matching sales, using the same dates, categories, and valuation policy for both inputs.
  • Set cost targets from your recipes and revenue mix instead of treating an industry average as a diagnosis for your bar.
  • Scannabar supports barcode-enabled inventory measurement and product-level reporting that help you review the evidence behind stock and usage discrepancies.
  • Reconcile count errors, purchasing records, transfers, waste, and recipe mapping before drawing conclusions about the cause of unexplained beverage variance.

What Is Liquor Inventory Control?

Liquor inventory control accounts for stock entering, moving through, and leaving your operation. It connects a physical count with the records that explain what changed between counts.

Buying and selling records alone cannot establish consumption. Some purchases remain on the shelf, some stock moves to another outlet, and some product is consumed without an ordinary sale. Opening and closing counts establish the boundaries for reviewing those movements.

Your objective is a traceable record of stock and usage. That record supports purchasing decisions, financial reviews, and operational investigations. It also protects staff from being blamed for discrepancies that originate in incomplete records or inconsistent measurements.

Define the Inventory Scope Before Counting

Inventory scope specifies the locations, categories, and dates covered by your review. Document those boundaries before your first count so receiving and sales records can be matched to the same operation.

A hotel-wide report may include a central storeroom, restaurant, lobby bar, and banquet operation. An outlet report includes only its assigned stock. Transfers between included locations cancel at property level but must be recorded for each outlet.

Define spirits, wine, beer, and other ingredients consistently. A spirits-only cost calculation should not use all restaurant sales as its denominator. Mixing categories can make a ratio look favorable while concealing the economics of the category you intended to review.

Build a Reliable Liquor Inventory Process

A reliable liquor inventory process records stock movements, measures opening and closing quantities, and reconciles usage against matching sales. Assign ownership for each step and document how exceptions are handled.

Your process should remain consistent when staff change. A written routine, named reporting locations, standardized units, and retained count records make periods comparable. The hotel bar SOP provides related operating guidance.

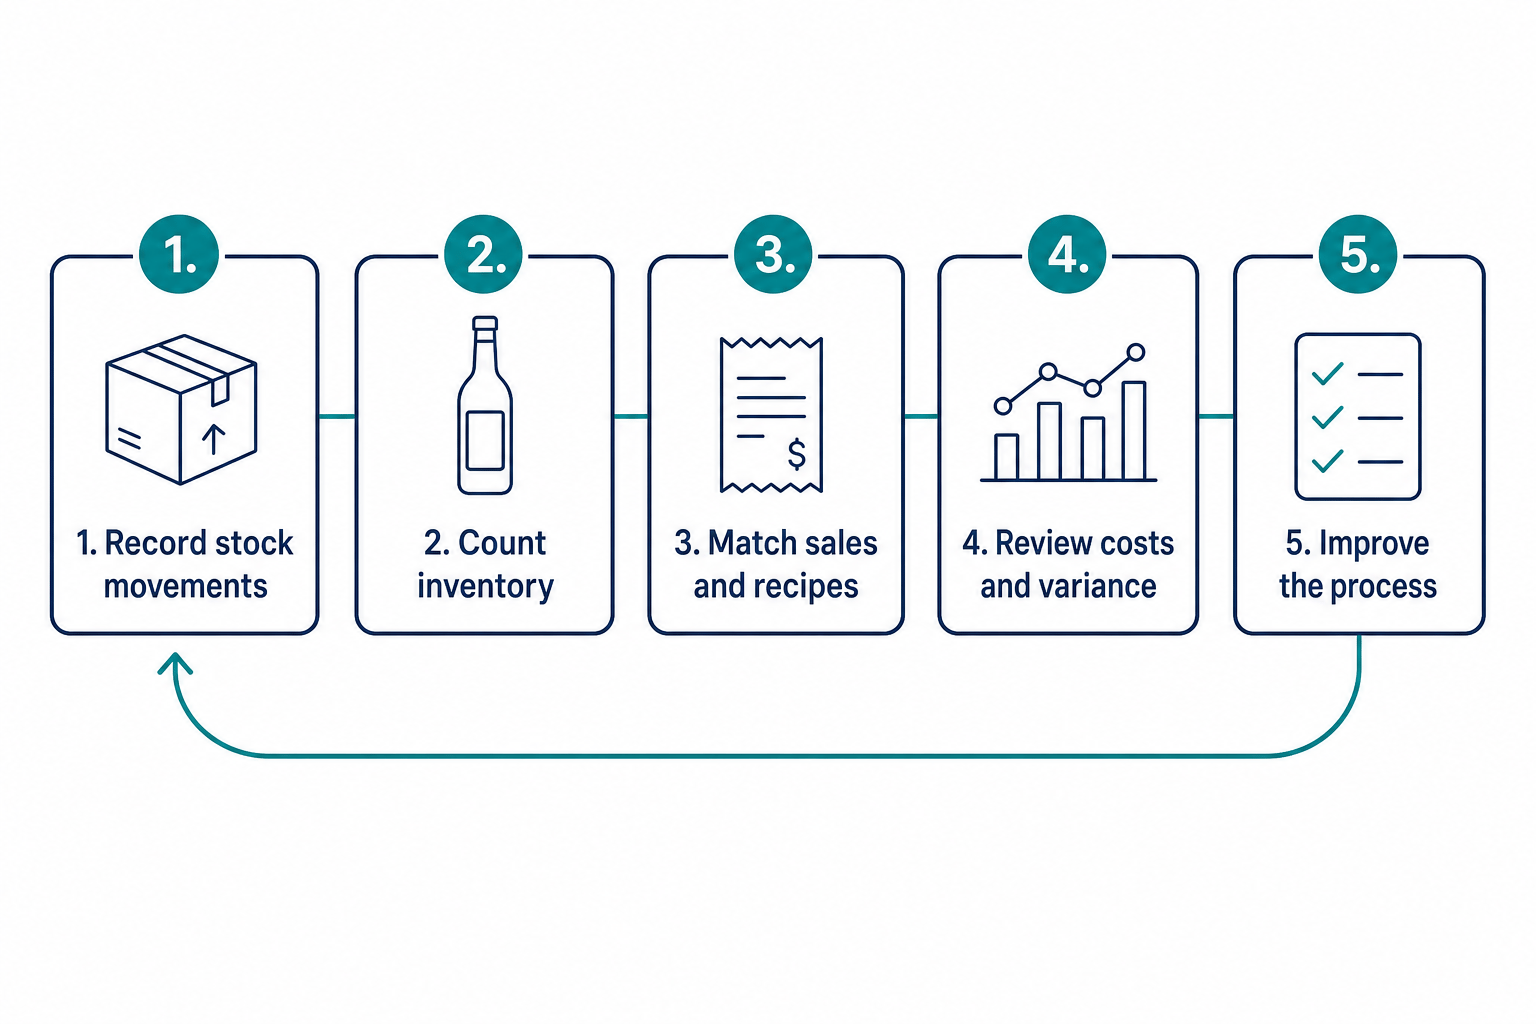
Inventory review cycle: record movements, count stock, match sales and recipes, review costs and variance, and improve the process
Record movements → Count inventory → Match sales and recipes → Review costs and variance → Improve the process. Repeat using consistent reporting periods.

Record Receiving, Returns, and Transfers

Receiving records establish what stock entered your operation and at what cost. Compare the delivery with its invoice and order, noting substitutions, damage, shortages, and bottle-size differences before accepting the record as complete.

Capture product, date, quantity, unit, location, supplier, and invoice reference. Record supplier returns and credits separately so an adjustment is not deducted twice. Distinguish delivery dates from accounting entry dates when reconciling period boundaries.

Transfer records need sending and receiving locations, quantity, product, date, and confirmation. A case moved from storage to a service bar is not a sale. If only one side records that movement, both outlet reports can become misleading.

Standardize Units and Partial-Bottle Measurements

Standardized units make inventory quantities comparable across receiving, recipes, and counts. Keep bottle sizes distinct and convert cases or other purchase units into the units your calculations use.

For open bottles, document the measurement method and apply it consistently. A bottle-equivalent value must refer to its stated capacity; half of a 750 mL bottle is different from half of a 1 L bottle.

Train counters with the same products and counting sequence. Review unexplained changes in partial-bottle values before treating them as depletion. Your inventory method should produce repeatable observations rather than depend on each person's interpretation.

Align Count Boundaries With Sales Periods

Count boundaries define when the opening stock period ends and the next one begins. Match sales, receipts, transfers, and adjustments to those same boundaries.

A count taken before opening can provide a clear closing boundary for the prior operating period. If service continues during a count, document intervening sales and stock movements or use a procedure that accounts for them.

Record the count time, areas covered, and reviewer. Retain the original snapshot before correcting an error so you can understand what changed. A revised count should improve the record, not erase the evidence of the original discrepancy.

Reconcile Stock With Sales and Recorded Usage

Reconciliation compares inventory-derived usage with recipe expectations and documented non-sale use. It requires more than comparing purchase invoices directly with sales revenue.

Calculate quantity used from opening stock plus receipts and transfers in, minus transfers out, supplier returns, and closing stock. Convert quantities to a consistent cost basis when preparing financial comparisons.

Then reconcile recorded sales, approved complimentary servings, waste, and other documented use. Product-level usage reports help organize this review. Keep unresolved discrepancies separate from legitimate use rather than assigning a cause before the records support one.

Calculate Liquor Cost and Gross Margin

Liquor cost percentage measures consumption cost as a share of matching net liquor sales. Use inventory values at cost and exclude sales taxes and tips consistently with your accounting policy.

Usage cost = Opening inventory + Purchases + Transfers in − Transfers out − Supplier returns − Closing inventory.

Liquor cost percentage = Usage cost ÷ Matching net liquor sales × 100. If purchases are already net of returns or credits, do not deduct those adjustments again. If sales are zero, the percentage is undefined.

Use a Worked Liquor Cost Example

This hypothetical weekly example begins with $8,000 in stock. Purchases are $4,500, transfers in are $300, transfers out are $200, supplier returns are $150, and closing inventory is $7,800.

Usage cost is $8,000 + $4,500 + $300 − $200 − $150 − $7,800 = $4,650. With matching net sales of $22,000, liquor cost is $4,650 ÷ $22,000 × 100 = 21.14%.

These figures illustrate the method, not a recommended target. The companion article How to Calculate Liquor Cost in 5 Simple Steps (2026) develops the calculation into a detailed workflow.

Keep Gross Margin Separate From Net Profit

Gross margin describes the sales remaining after product cost, before other operating expenses. For the hypothetical example, gross profit is $22,000 minus $4,650, or $17,350; gross margin is approximately 78.86%.

Net profit also reflects labor, occupancy, utilities, and other expenses. A beverage category can produce a favorable gross margin while the business remains unprofitable. Evaluate the cost ratio alongside sales volume and operating costs.

Cheryl Stanley, Senior Lecturer at Cornell's Nolan School of Hotel Administration, addresses pricing and controls in her beverage program course. Those management decisions belong in the same financial review.

Maintain a Consistent Inventory Valuation Policy

A consistent valuation policy makes opening stock, receipts, closing stock, and recipe costs comparable. Agree the policy with your accountant and document how changing supplier costs are handled.

Do not silently replace every historical cost with the latest invoice price. A valuation change can alter reported usage without changing the physical quantity consumed. Separate genuine supplier-cost changes from quantity discrepancies during your review.

Keep a record of adjustments and their reasons. If you change a valuation method, explain the effect before comparing the new ratio with prior periods. An apparent improvement may otherwise reflect accounting treatment rather than operational progress.

Set a Liquor Cost Target for Your Bar

A useful liquor cost target comes from your recipe quantities, ingredient costs, net selling prices, and revenue mix. There is no universal percentage that proves every bar is operating well.

Cost each recipe using the quantities you intend to serve. Divide ingredient cost by its matching selling price to calculate the expected ratio. Maintain the same ingredient scope in actual and theoretical calculations.

For a hypothetical drink with $2.80 of ingredients and a $14 net price, theoretical cost is 20%. This is an illustrative recipe result, not a benchmark for an entire beverage program.

Weight Category Targets by Revenue Share

A revenue-weighted target multiplies each category's theoretical cost ratio by its share of sales revenue and adds the results. Weighting by drink counts instead can distort the blend when prices differ.

In a hypothetical program, spirits produce 50% of revenue at an 18% target, beer produces 25% at 24%, and wine produces 25% at 32%. The blended target is 0.50 × 18% + 0.25 × 24% + 0.25 × 32% = 23%.

These category ratios are examples, not recommendations. The companion article What Is a Good Liquor Cost Percentage for Your Bar? explains how to interpret your own target and actual results.

Review Pricing, Costs, and Sales Mix Together

Changes in purchasing costs, selling prices, and sales mix can alter your cost percentage without indicating unauthorized usage. Recalculate your baseline when those inputs change materially.

A shift toward a higher-cost category raises the blended target even when every recipe is followed. Review category results before changing portions or attributing the increase to staff performance.

Separate price effects from quantity effects whenever possible. Maintain guest-quality standards while reviewing the financial result. A lower percentage achieved through under-portions does not establish a healthier operation or a more dependable guest experience.

Organize a Bar Inventory Spreadsheet

A bar inventory spreadsheet should connect product identity, quantities, units, locations, and costs. Use dated count snapshots and separate movement logs so closing stock does not have to explain every transaction by itself.

Core fields include SKU, product name, category, bottle size, counting unit, location, opening quantity, closing quantity, and unit cost. Receiving and transfer records provide the changes between those snapshots.

Keep wine inventory distinct where serving formats and storage locations differ. The companion article Bar Inventory Spreadsheet: Fields, Formulas, and Examples provides a worked worksheet.

Protect Formulas and Retain Movement Records

Protected formulas and retained movement records reduce accidental changes that can distort your worksheet. Limit edits to approved input cells and use consistent product and location names.

Maintain receiving, returns, transfers, and documented waste separately. A waste record explains consumption without a sale, but it should not be removed from actual physical usage when calculating total consumption cost.

Archive each period before starting the next. If an error is corrected, retain the reason and reviewer. This record makes repeated issues visible and helps you distinguish a spreadsheet error from a purchasing or portion-standard problem.

Avoid Mixed Units and Percentage-Formatting Errors

Mixed units and incorrect percentage formatting can create false cost results even when the physical count is accurate. Validate the unit attached to each quantity before using it in a formula.

Convert a case receipt to bottles when bottles are your counting unit. Track different capacities separately. For beer and dry goods, define keg, package, and ingredient units explicitly.

In a spreadsheet, a ratio of 0.2314 becomes 23.14% when percentage formatting is applied. Do not multiply by 100 and then apply percentage formatting again, or the displayed result will be inflated.

Compare Actual and Theoretical Beverage Cost

Actual beverage cost measures inventory consumed; theoretical beverage cost estimates recipe-based consumption for recorded sales. Their difference identifies a discrepancy that needs reconciliation, not a proven cause of loss.

Theoretical cost = Sum of recorded item sales × Standard recipe cost per item. Match dates, locations, ingredient scope, and cost basis before comparing it with inventory-derived actual cost.

Dollar variance = Actual cost − Theoretical cost. Document whether your theoretical measure covers sales alone or also includes approved non-sale usage. Changing that definition changes what remains unexplained.

Interpret Dollar Gaps and Percentage-Point Differences

Dollar variance states the cost difference; a percentage-point gap compares the two ratios using matching sales revenue. Do not describe a percentage-point change as a relative percentage increase.

In a hypothetical period with $20,000 in sales, theoretical cost of $4,000 is 20%. Actual cost of $4,700 is 23.5%. The gap is $700, or 3.5 percentage points.

Reconcile documented non-sale use and record errors before interpreting the remaining difference. The companion article Actual vs. Theoretical Beverage Cost: Explain the Gap develops this comparison into an investigation process.

Review Negative Variance and Category Offsets

Negative variance means actual cost is below the theoretical expectation, but it still needs review. Possible explanations include under-portions, overstated recipes, omitted purchases, or count errors.

Do not reward a low blended result without checking its components. Positive variance in one product can be offset by negative variance elsewhere, concealing both issues in a property-wide total.

Compare quantities as well as values when supplier costs change. A consistent variance review should distinguish pricing, measurement, mapping, and operational causes rather than treat every difference as missing product.

Improve Purchasing and Stock Availability

Purchasing decisions should use current counts, recent usage, delivery lead times, and expected service demand. Stock availability and cash tied up in inventory both belong in the decision.

Ordering too little can cause substitutions and missed sales. Ordering too much ties up cash and may expose perishable or opened products to waste. Evaluate an extra case against likely use rather than a discount alone.

Consider approved events, reservations, seasonal demand, and supplier delivery schedules. Historical usage informs the order, but it should not be treated as a complete forecast when operating conditions have changed.

Distinguish Par Levels From Reorder Points

A par level is the target quantity you order up to; a reorder point is the stock level that triggers an order. Define both consistently in your operation.

A basic reorder point equals expected demand during lead time plus a safety buffer. In a hypothetical example, usage of two bottles daily, three days of lead time, and four safety-stock bottles produce a ten-bottle reorder point.

For ordering, consider usable stock, confirmed stock already on order, and scheduled requirements. Review the buffer when deliveries or demand become less predictable instead of increasing every product's par indiscriminately.

Investigate Discrepancies Before Assigning Blame

Investigate the records and operating process before attributing a discrepancy to intentional loss. A variance report narrows what needs examination; it does not establish individual responsibility.

Check physical coverage, receiving, transfers, POS mapping, recipes, and documented non-sale use in a consistent sequence. Retain the evidence and correction applied so the next review can confirm whether the issue recurs.

A repeatable beverage audit gives staff a clear process. Share verified findings and expectations, rather than starting a discussion with an accusation based on an aggregate ratio.

Check Counts, Receiving, and Transfers First

Count and movement checks establish whether your actual-usage inputs are reliable. Recount affected items where practical, verify all storage areas, and compare receipts with supplier records.

Check for duplicate invoices, unrecorded credits, unit errors, and deliveries entered in the wrong period. A missing receipt can understate consumption; a duplicate can overstate it. Different errors do not all move variance in the same direction.

Confirm both sides of a transfer and its reporting scope. At outlet level, undocumented movement can appear as a shortage in one location and surplus in another without changing total property stock.

Check Recipes, POS Mapping, and Non-Sale Use

Recipe and sales-mapping checks establish whether your theoretical expectation matches the drinks recorded. Review substitutions, recipe changes, item buttons, and serving quantities for affected products.

Reconcile approved complimentary servings, breakage, spills, returned drinks, and tastings. These explain non-sale consumption when recorded accurately. Keep them in total actual usage, then account for them when calculating the residual unexplained gap.

Review persistent patterns only after correcting the inputs. Escalate concerns through your documented management procedures and applicable policies. An item-level discrepancy is evidence to examine, not permission to assume who caused it.

How Scannabar Supports Inventory and Cost Control

Scannabar supports inventory measurement, stock tracking, and usage reporting for hospitality operations. Those capabilities help connect the physical count with the records used in a cost review.

Scannabar's liquor inventory system provides barcode-enabled measurement and reporting by product and outlet. Its POS reconciliation supports comparison of observed usage with recorded sales.

Use the reports alongside documented receiving, transfers, and recipes. A system can organize inputs and identify discrepancies, but interpreting a gap still requires operational records and a fair investigation.

Build Accountability Around Evidence

Evidence-based accountability makes responsibilities and records visible without treating inventory control as a presumption of misconduct. Define who receives, counts, reviews, and approves adjustments.

Scannabar's inventory controls support product and location visibility. Use that visibility to focus training and reviews on the process that needs improvement.

Let staff explain legitimate stock movements and document the outcome. Close each review with a specific action, owner, and follow-up date. The next period should show whether the correction improved the record or whether further investigation is needed.

Build a Repeatable Cost-Control Routine

A repeatable routine brings count preparation, physical observations, reconciliation, and purchasing review into one scheduled process. Choose a cadence that fits your service volume, risk, and available staff.

More frequent reviews shorten the period you need to investigate, but accuracy matters as much as frequency. A rushed count with unmatched boundaries can create more confusion than a carefully documented one.

Start with a clear operating standard and improve it as recurring exceptions become visible. Each review should leave a retained snapshot, explained adjustments, and named actions rather than only a new percentage.

Use a Count-Period Checklist

A count-period checklist makes the review sequence visible and assigns the evidence needed at each stage. Adapt this sequence to your locations and accounting policy.

  • Before counting: Confirm receiving, transfers, returns, and sales boundaries; prepare the product and location list.
  • During counting: Cover every location, use consistent units, record partial quantities, and document exceptions.
  • After counting: Calculate usage, reconcile sales and non-sale use, and flag unexplained item-level differences.
  • During management review: Check costs and revenue mix, agree corrective actions, and update purchasing requirements.
  • Before the next cycle: Confirm actions were completed and retain prior records for comparison.

A checklist should reflect your actual operating procedure. Review omissions and recurring corrections so the process improves rather than reproduces the same exceptions each period.

Build a Connected Inventory and Cost-Control System

Connected inventory control turns counts and movement records into decisions you can explain. Start with a defined scope, reliable units, and matched reporting boundaries.

Then calculate consumption cost, establish recipe-based targets, and investigate variance with evidence. Use the companion articles for deeper calculations and spreadsheet design as each resource becomes available.

Your next step is a documented routine with clear ownership. Consistent reviews support better purchasing and fairer operational decisions while keeping gross margin, net profit, and unexplained usage distinct.

FAQs About Liquor Inventory and Cost Control

Does a high liquor cost percentage prove theft?

No. High cost can reflect pricing, sales mix, supplier changes, record errors, waste, or unauthorized usage. Scannabar's product-level reports help narrow the review, but evidence from counts, movements, recipes, and approved non-sale use is necessary before attributing a discrepancy to anyone.

How often should you count liquor inventory?

Choose a count frequency that fits your volume, risk, and ability to maintain reliable records. Scannabar's counting workflow supports regular reviews. Shorter periods can narrow investigations, but matched boundaries and consistent measurements remain necessary at any cadence.

Can inventory software replace physical observations?

No. Reliable inventory needs trustworthy observations and documented stock movements. Scannabar supports barcode-enabled measurement and usage reporting, but incomplete receiving or transfer records can still distort the result. Use software with a defined operating routine and retained review evidence.

Is there one correct liquor cost target?

No. Your target depends on recipes, ingredient costs, prices, and revenue mix. A recipe-based target provides a defensible starting point. Compare actual consumption with that expectation and investigate changes before assuming a published average is appropriate for your operation.

Should waste be excluded from actual usage cost?

No. Waste consumes product and remains part of inventory-derived usage cost. Document it separately so you can explain the gap between physical consumption and sales-based theoretical usage. Deduct documented non-sale use when analyzing residual unexplained variance, not when measuring total consumption.

Topics: managing liquor inventory cost, Liquor cost, alcohol cost, Reducing Liquor Costs, controling costs, managing liquor costs

How to Count Liquor Inventory Faster in 7 Easy Steps (2026)

Posted by Nick Kaoukis on Thu, Oct, 01, 2026 @ 17:10 PM

Your liquor inventory count takes three or four hours every week. During that time, your staff is off the floor, your managers are buried in clipboards, and your bar is burning labor dollars on a task that generates zero revenue.

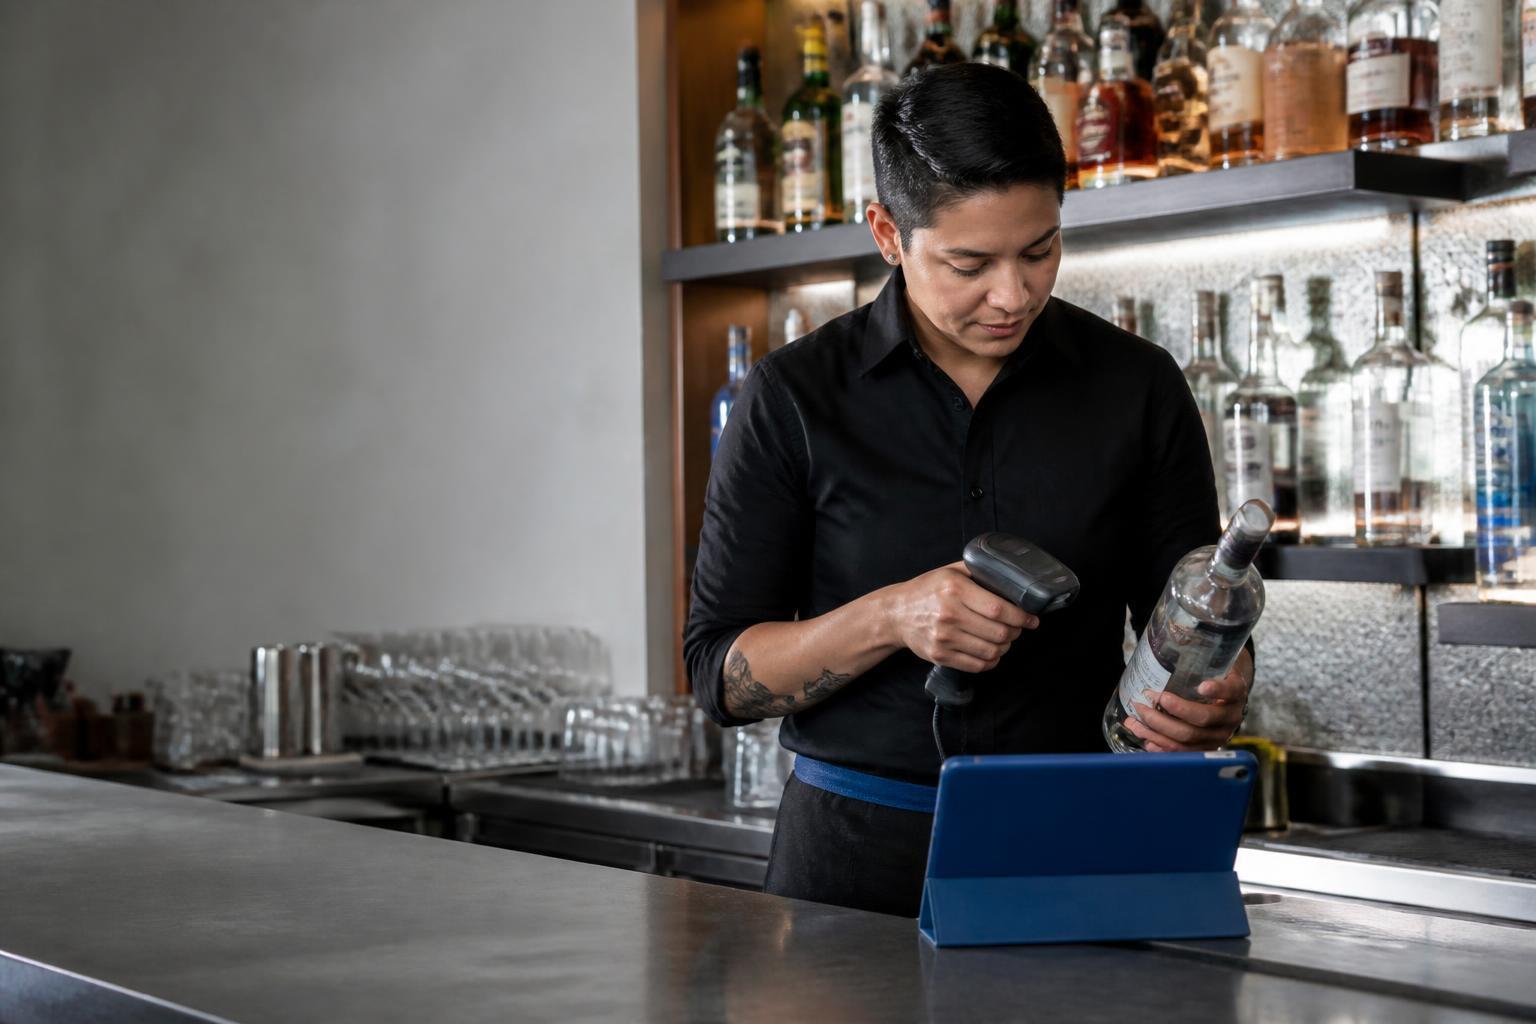
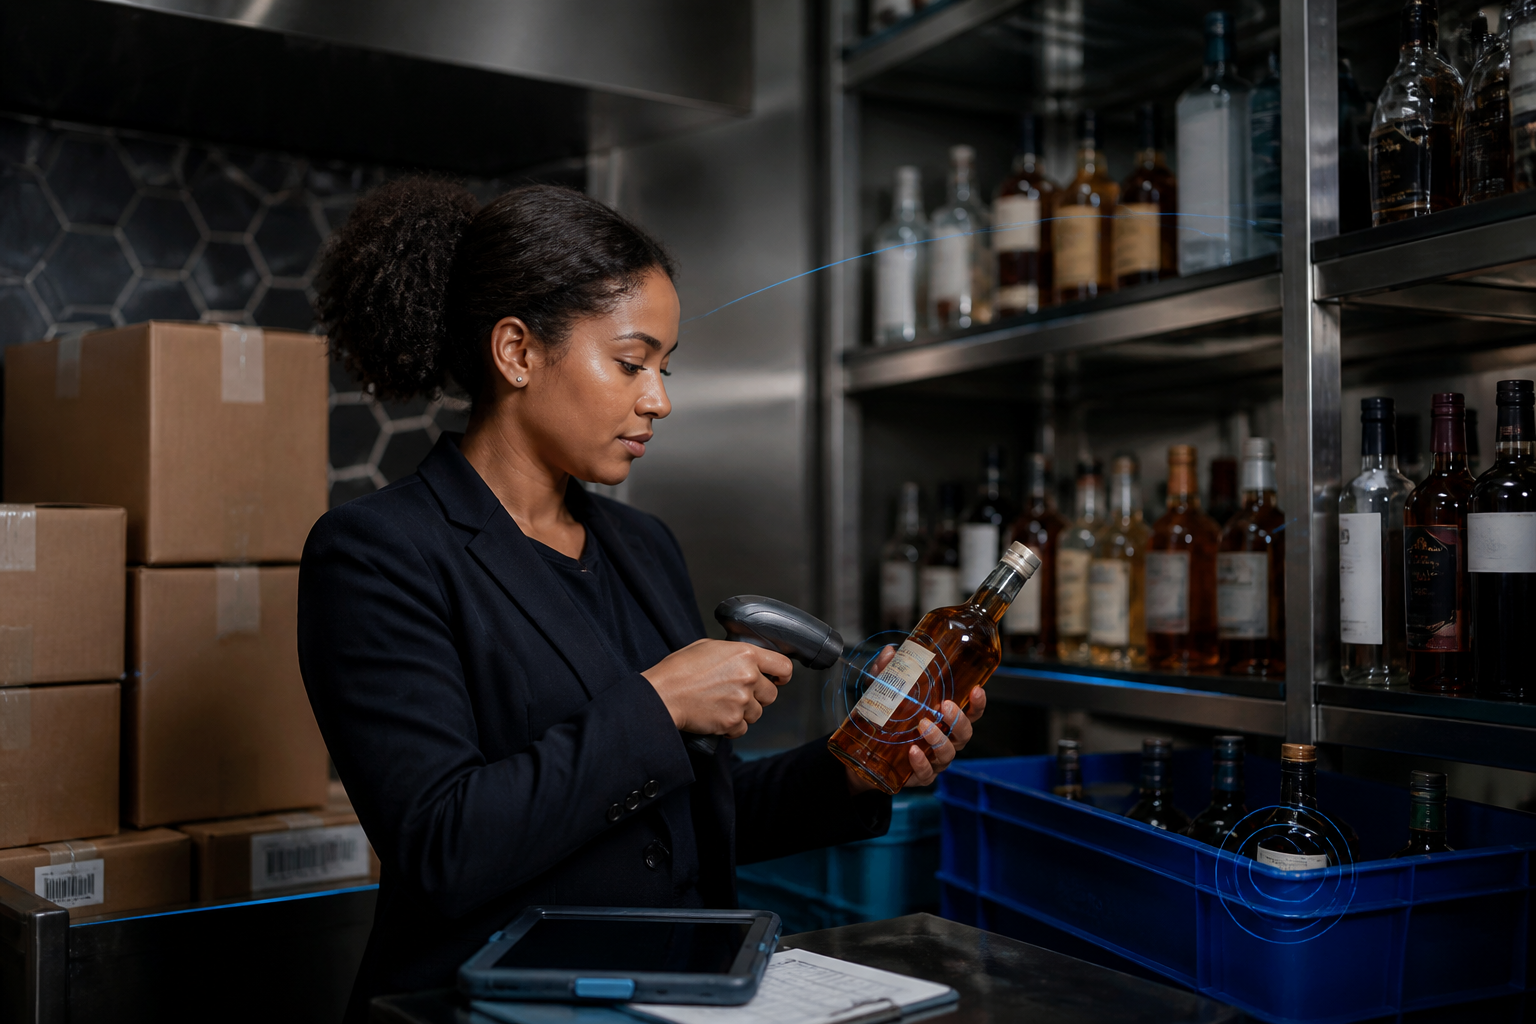
Bar manager scanning liquor bottles during an inventory count

Scannabar gives you a faster path: bar inventory software built around barcode scanning and bottle weighing that cuts counting time by up to 75%. This guide walks you through seven steps for finishing your liquor counts in a fraction of the time.

Below you will find seven clear steps, from setting up your product list to reviewing variance data the morning after. Each step is built for bar managers, restaurant operators, and hotel F&B directors who already know what pour cost means and want to stop losing money to slow, inaccurate counts.

Quick Guide: How to Count Liquor Inventory Faster in 7 Easy Steps

  1. Build and organize your master product list - Sort every SKU by physical shelf location so your team counts in one straight pass.
  2. Tag every bottle at receiving - Apply a unique barcode label to each bottle the moment it arrives at your establishment.
  3. Set up your barcode scanner hardware - Configure a rugged handheld device paired with your inventory software for fast, reliable scanning.
  4. Use bottle weighing for open bottles - Place partial bottles on a calibrated scale to capture exact fluid levels instead of guessing.
  5. Count shelf by shelf in a single pass - Move left to right, top to bottom, scanning and weighing without backtracking.
  6. Reconcile counts against POS sales data - Import your register sales and compare what you poured against what you rang in.
  7. Review variance reports and act on outliers - Flag any product with more than 5% variance and investigate before the trail goes cold.

How to Speed Up Your Liquor Inventory Count

1. Build and organize your master product list

A fast count starts before you touch a single bottle. Walk every area of your operation: the main bar, back bar, service wells, walk-in cooler, dry storage, and any satellite or banquet bars. Record every product by brand name, bottle size, and category.

Here is the critical part: sort that list by physical shelf location, not by spirit category. When your team counts, they move in one straight line across each shelf. Jumping from vodka to tequila and back wastes minutes that add up across hundreds of bottles.

A typical bar carries 150 to 400 products. Larger hotel bars and nightclubs can hit 500 or more. Build the list once, load it into your inventory software, and reuse it for every count cycle.

The Scannabar Inventory System lets you organize products by location and pull the same shelf-ordered list on your handheld scanner each time.

2. Tag every bottle at receiving

Every bottle that enters your establishment needs a unique barcode identity. When a delivery arrives, pull a numbered barcode label from the roll, scan the existing UPC on the bottle to capture its brand, size, and volume profile, then scan the Scannabar label to bind that tag to that specific bottle.

From this point forward, the system tracks that bottle through storage, transfer to the bar, measurement during counts, and final disposal. This is how Scannabar identifies a missing bottle at any location within your establishment. No other step in the process matters if the bottle never got tagged at the door.

Tagging a full case takes seconds. For high-volume venues receiving dozens of cases per week, assign one staff member to handle receiving and labeling as a dedicated task rather than an afterthought.

3. Set up your barcode scanner hardware

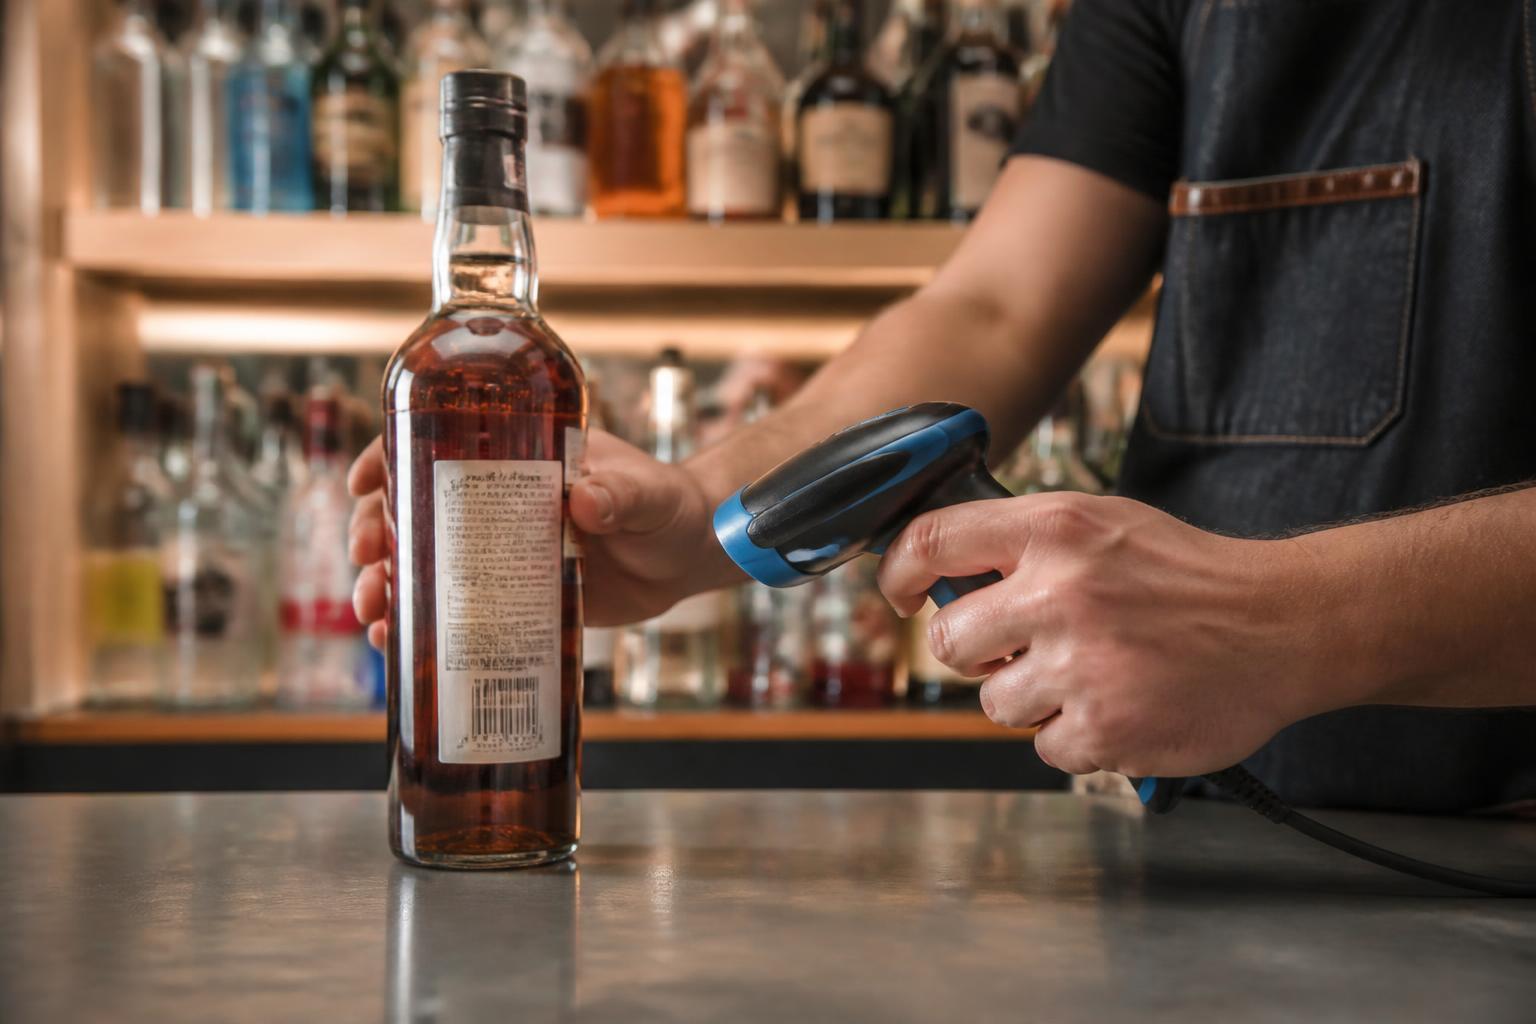
Bar employee scanning the barcode on a liquor bottle

Scannabar runs on purpose-built handheld scanners from manufacturers like Zebra and Motorola. These devices are designed for wet, fast-paced bar environments. They survive spills, hold a charge through a full multi-bar count, and stay on the premises because they are not your bartender's personal phone.

Pair the scanner with your Scannabar software, confirm the product list is loaded, and test a few scans before count night. A scanner that reads labels in under a second eliminates the fumbling and re-scanning that slows down smartphone-based apps.

For multi-location operations, each venue gets its own handheld. Scannabar supports multiple fixed, portable, seasonal, and banquet bars under a single account, so your corporate office can pull consolidated reports without merging spreadsheets.

4. Use bottle weighing for open bottles

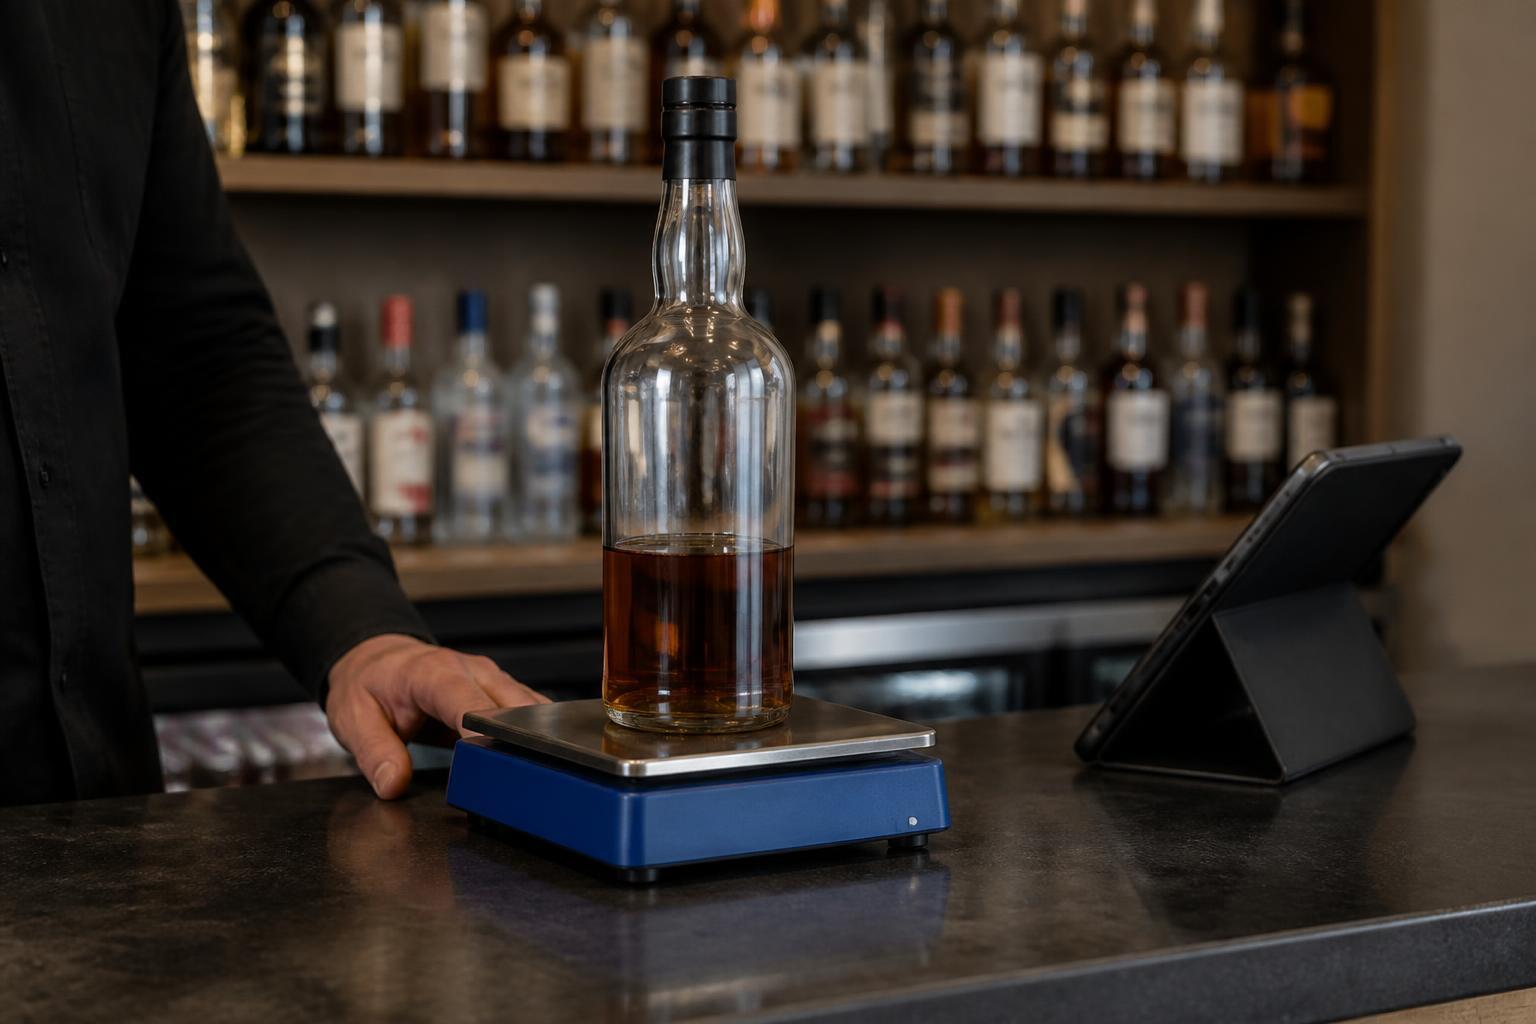
Partially filled whiskey bottle on a digital inventory scale

Open bottles are where most counting accuracy falls apart. Visual estimation, sometimes called “tenthing,” is subjective. Two managers will give you two different numbers for the same bottle, and across 300 open bottles, that inconsistency makes your variance data unreliable.

A calibrated scale converts weight to remaining fluid ounces in seconds. Place the bottle on the scale, let the system record the exact level, and move on. No debating whether a bottle is one-third or one-half full.

Scannabar takes this a step further with per-bottle calibration and a patented measuring strip that runs along the height of the bottle. The scanner reads the level directly, so you get measurement accuracy without weighing every bottle individually.

For your premium spirits, where a few ounces of variance can represent significant dollars, this precision pays for itself quickly.

5. Count shelf by shelf in a single pass

Start at the same spot every time: top shelf, far left. Move right across the shelf, then drop to the next row. Scan full bottles, weigh or measure open ones, and let the software record everything in real time. Do not skip back to recount something you passed.

This one-pass method works because your product list is already sorted by shelf position. The scanner knows what should be next. If something is out of place, flag it and keep moving rather than stopping to reorganize mid-count.

A 120-bottle bar using Scannabar's barcode scanning finishes in about 15 minutes. Multiple staff members can count different zones simultaneously. One person takes the main bar, another handles storage, and the system merges their counts automatically. That parallel workflow is how large hotels and multi-outlet properties finish full-property inventories before the next shift clocks in.

6. Reconcile counts against POS sales data

A count by itself is just a list of numbers. The count becomes useful when you compare it against what your POS system says you sold.

Scannabar pulls sales data via CSV, XML, or a direct API connection to your POS vendor's published specification. Systems like Aloha, Micros, MaitreD, POSitouch, Digital Dining, Pixel Point, and InfoGenesis all connect.

The formula is straightforward: previous inventory plus purchases minus current inventory equals usage. Compare that usage to what the POS recorded as sold. The gap between those two numbers is your variance, the unaccounted product that represents shrinkage.

Automate this reconciliation instead of building formulas in a spreadsheet. When the math runs inside your inventory system, you get results the morning after the count instead of three days later when nobody remembers what happened on Saturday night.

7. Review variance reports and act on outliers

The report is only valuable if someone reads it within 24 hours. Look first at the highest-dollar variances, not the highest-percentage ones. A 30% variance on a slow-moving bottle of amaro costs you less than a 6% variance on your top-selling vodka.

Investigate before the trail goes cold. A variance discovered this week still belongs to a shift that is on the schedule. A variance discovered next month belongs to nobody. Weekly counting frequency, made possible by a fast scanning process, gives you the data resolution to connect discrepancies to specific bartenders, shifts, or events.

Scannabar's variance reports break down results by product, outlet, and count period. When you spot a pattern, you have the documentation to have a specific, productive conversation with your team rather than a vague accusation. That is the difference between a culture of accountability and a culture of suspicion.

What causes the biggest time losses during bar inventory counts?

Three process failures eat most of your counting time. The first is an unsorted product list that forces counters to jump between shelves and storage areas. The second is visual estimation of partial bottles, which creates arguments, recounts, and unreliable data.

The third is manual data entry after the count, where someone spends another hour transcribing numbers into a spreadsheet. Each of these failures compounds, and fixing all three is what separates a 15-minute count from a 4-hour one.

A disorganized list adds 30 to 45 minutes. Partial-bottle debates add another 20 minutes across a full bar. Post-count data entry can double the total labor cost of the inventory process.

The fix is process design, not effort. When the product list matches the shelf order, the counting method eliminates subjectivity, and the data flows directly from the scanner to the software, counting stops being a dreaded chore and becomes a quick operational checkpoint.

How often should you count liquor inventory for accurate variance tracking?

Weekly counting is the standard for any bar serious about controlling shrinkage. According to the National Restaurant Association's 2026 State of the Industry report, persistent cost pressures continue to challenge operator margins, making tighter inventory controls more urgent than ever.

When you count every seven days, you catch variance while the staff schedule is still fresh, connect losses to specific shifts, and build a data trail that makes patterns visible within weeks rather than quarters.

Monthly counting is too infrequent for meaningful variance analysis. By the time you discover a problem, four weeks of losses have accumulated. You cannot pinpoint which bartender, shift, or event caused the gap. The data becomes a historical record of money already lost rather than an actionable control mechanism.

The reason most bars default to monthly counts is that their counting method takes too long. When a full count requires three or four hours of labor, weekly counts are impractical.

Barcode scanning and bottle weighing compress that time enough to make weekly counts realistic for venues of any size. Some operators using Scannabar run spot-checks on their highest-value spirits daily because each check takes minutes, not hours.

How Scannabar Helps You Count Liquor Inventory Faster

Scannabar was built inside working bars, not in a software lab. The system uses barcode scanning and per-bottle tracking to turn a multi-hour count into a task that takes minutes.

A bar code strip on each bottle lets the handheld scanner read the exact fluid level. You skip the guessing, the weighing debates, and the post-count data entry entirely.

Venues running Scannabar consistently operate at 1% to 3% shrinkage, compared to the industry average of 20% to 25%. That gap translates directly to your bottom line. For a bar generating $500,000 in annual revenue, reducing shrinkage from 20% to 3% puts tens of thousands of dollars back into your operation every year.

The Scannabar Inventory System integrates with your existing POS, delivers real-time variance analysis, and includes seven-day-a-week customer support. Your team can be operational within a single shift.

The system was designed for hospitality professionals who do not have time for a lengthy software rollout. Visit Scannabar to see how your venue can start counting faster and losing less.

FAQs About Counting Liquor Inventory Faster

How long does a liquor inventory count take with barcode scanning?

A 120-bottle bar using Scannabar's barcode scanning typically finishes a full count in about 15 minutes. Larger venues with 400 or more products complete counts in under an hour when multiple staff members scan different zones simultaneously. That is roughly 75% faster than a clipboard-and-spreadsheet approach.

Do I need to weigh every bottle during inventory?

You only need to weigh or measure open bottles. Full, sealed bottles get a quick barcode scan and a unit count. Scannabar's patented measuring strip provides an alternative to traditional scale weighing by reading the fluid level directly from the bottle, which speeds up the partial-bottle step significantly.

Can barcode scanning help prevent bartender theft?

Barcode scanning creates a documented chain of custody for every bottle from receiving to disposal. Scannabar tracks each bottle individually, so a missing bottle triggers an alert.

When your team knows every bottle is tracked and variance is reviewed weekly, it creates a culture of accountability that reduces the temptation for theft and protects honest staff from false accusations.

What POS systems work with Scannabar for inventory reconciliation?

Scannabar integrates with major hospitality POS platforms including Aloha, Micros, MaitreD, POSitouch, Digital Dining, Pixel Point, Restaurant Manager, and InfoGenesis. Data transfers via CSV, XML, or direct API, depending on your vendor's specifications. The system also connects with property management platforms for hotel operations.

Is barcode scanning accurate enough for high-value spirits?

Barcode scanning combined with Scannabar's per-bottle calibration delivers measurement accuracy to a fraction of an ounce. For premium spirits where a single bottle can cost over $100, that precision matters. The system removes human subjectivity from the count, so your variance data reflects actual usage rather than estimation differences between staff members.

How quickly can my team learn a barcode-based inventory system?

Most teams using the Scannabar Inventory System become operational within a single shift. The handheld scanner interface is straightforward: scan the barcode, confirm the product, record the level, and move to the next bottle. Scannabar includes onboarding support and seven-day-a-week customer service to handle any questions during the transition from your current counting method.

Topics: liquor inventory, Bar inventory, Hotel Inventory, liquor inventory timing, inventory counting, inventory control, liquor inventory system, liquor management, liquor inventory app

How to Build a Hotel Bar Inventory SOP in 7 Steps (2026)

Posted by Nick Kaoukis on Wed, Sep, 23, 2026 @ 13:09 PM

When inventory handling changes from shift to shift, your hotel bar loses control of its margins. One bartender counts by weight, the next estimates by eye, and the third skips the count entirely. The result: shrinkage that nobody can explain. For a hotel doing $800,000 in annual beverage sales, even a 15% loss rate means $120,000 vanishing with no paper trail.

A written bar inventory management SOP removes that ambiguity. It defines who counts, when they count, how they record every bottle, and what happens when the numbers do not match. Scannabar standardizes hotel inventory procedures across every outlet, making the SOP enforceable rather than aspirational.

This guide walks you through seven steps to build a repeatable inventory SOP for your bars, banquet areas, and beverage outlets.

Hospitality manager and bar lead reviewing a hotel bar inventory process beside organized bottles and labels

Quick Guide: How to Build a Hotel Bar Inventory SOP in 7 Easy Steps

  1. Set the scope and count window: Define which outlets, products, and time periods each count covers.
  2. Standardize receiving and delivery checks: Verify every shipment against the purchase order before signing off.
  3. Organize storage and bottle labeling: Assign bin locations and label every bottle for fast, accurate counts.
  4. Define how full and open bottles are counted: Pick one measurement method and apply it to every open container.
  5. Document transfers, breakage, and comps: Log every bottle that moves, breaks, or leaves inventory as a comp.
  6. Reconcile counts against sales and usage: Use Scannabar to compare physical counts with POS data automatically.
  7. Assign ownership, review cadence, and follow-up: Name who runs the process and how often results are reviewed.

How to Build Your Hotel Bar Inventory SOP

1. Set the scope and count window

Your SOP starts by answering three questions: what do you count, where do you count it, and when does each count happen? In a hotel, "what" typically means all liquor, wine, beer, and high-value dry goods across every revenue-producing outlet.

"Where" means naming each location individually: lobby bar, pool bar, restaurant bar, banquet prep area, wine cellar, and any service bar. Lumping outlets together destroys accountability because nobody can trace a variance to a specific room.

Set a fixed count window. Weekly counts for your top 20 highest-value products and monthly counts for everything else is a practical starting point. For a deeper look at weekly inventory benefits, the data is clear. Lock the day and time so the count always happens at the same point in the operating cycle.

2. Standardize receiving and delivery checks

Every SOP needs a receiving protocol that catches errors at the loading dock, not at month-end. When a delivery arrives, one designated person should match every line on the invoice to the actual cases and bottles on the pallet. Short shipments, wrong brands, and damaged goods get flagged before anyone signs off. For more on building a reliable receiving process, the fundamentals apply to every hotel.

Record the receiving data immediately: product name, SKU, quantity received, supplier, and the name of the person who verified the order. If your hotel uses a property management system or an inventory platform, that data should enter the system the same day.

An unverified delivery is an uncontrolled entry point. Shrinkage starts at the loading dock, not behind the bar.

3. Organize storage and bottle labeling

A disorganized storeroom makes every count slower and less accurate. Assign a fixed bin location for each SKU. Group products by category: spirits on one shelf, wines in a designated cooler or cellar, beer and draft supplies in a separate area.

Label every bottle that enters your inventory. Barcode labels are ideal because they remove the need for handwritten tags and eliminate identification errors during counts. Scannabar uses barcode scanning to identify each bottle instantly, so a full count of 120 bottles takes about 15 minutes.

Enforce a first-in, first-out rotation rule. Bottles received first should be pulled first. This prevents dead stock, keeps product fresh, and makes it easier to spot when something goes missing.

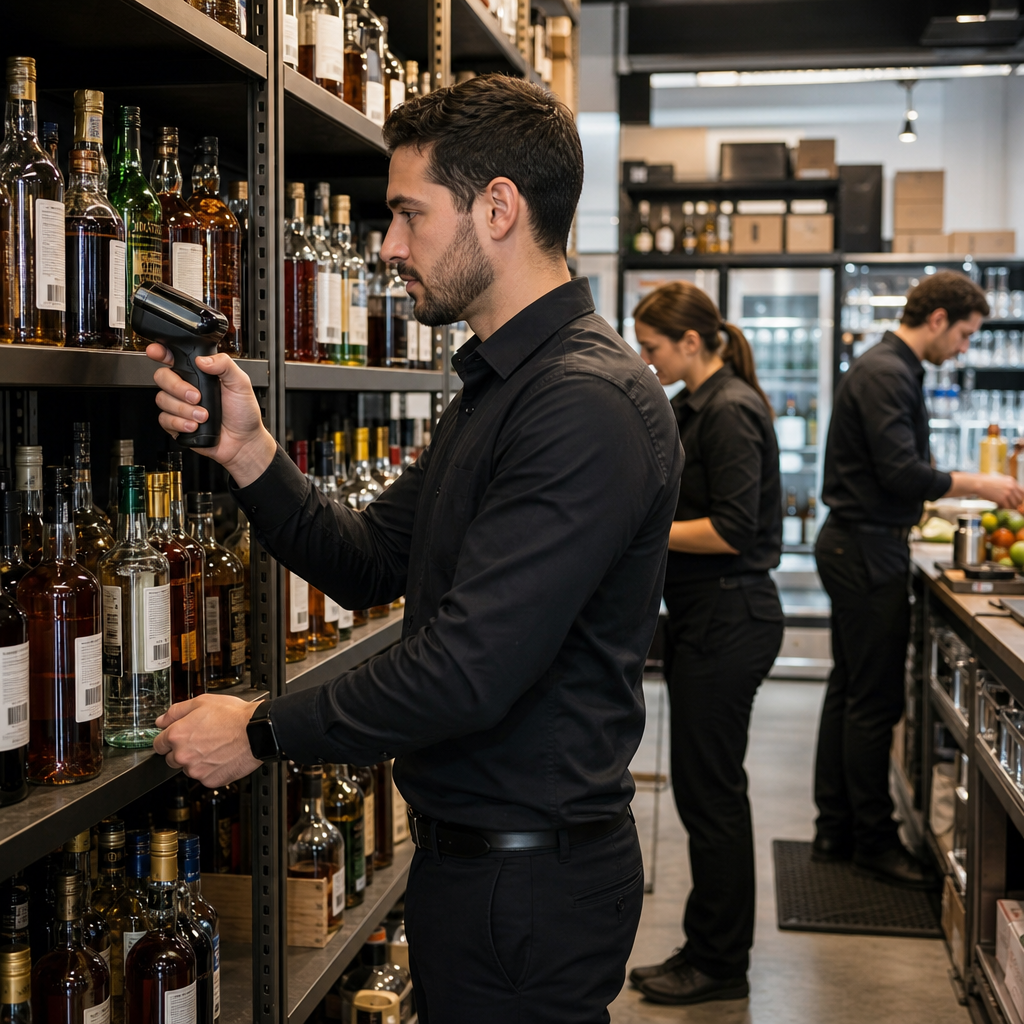
Hotel staff member scanning labeled beverage inventory in an organized bar storage area

4. Define how full and open bottles are counted

Sealed bottles are simple: count each unit. Open bottles are where most SOP breakdowns happen. If one person estimates by eye and another uses a ruler, your data will never be consistent enough to detect real variance.

Pick one method and document it in the SOP. Bottle-level measurement using a barcode-enabled scale or ruler provides the most precise data and removes human estimation from the process. Scannabar measures the exact contents of every open bottle, so your variance analysis starts from verified figures rather than rounded guesses.

Whatever method you choose, train every person who touches a count on the same technique. A consistent method with a small margin of error beats an inconsistent one with no margin at all.

5. Document transfers, breakage, and comps

In a hotel, bottles move between outlets constantly. The banquet team borrows vodka from the lobby bar. The pool bar sends leftover wine back to the cellar. Without documentation, those movements create phantom variances that make your data useless.

Build a transfer log into the SOP. Every inter-outlet movement needs a record: the product, the quantity, the origin, the destination, and the name of the person who authorized it. The same log should capture breakage, spoilage, and complimentary pours with a reason code attached.

Unrecorded comps are invisible shrinkage. A simple daily log signed by a manager keeps these losses visible and accountable.

6. Reconcile counts against sales and usage

Counting inventory is only half the process. The SOP must also define how your team compares what you counted against what the POS system says you sold. The difference between the two is your variance, and it tells you where profit is disappearing.

Scannabar automates this reconciliation by pulling sales data directly from your POS and comparing it against physical counts. The resulting variance report breaks down discrepancies by product, outlet, and time period, so your food and beverage director can identify exactly where losses originate.

Without reconciliation, a count is just a number. With it, a count becomes a diagnostic tool.

7. Assign ownership, review cadence, and follow-up

Every SOP needs a named owner. In most hotels, that is the bar manager or the F&B controller. This person is responsible for ensuring the count happens on schedule, the data gets recorded, and variances get investigated.

Set a review cadence. Weekly variance meetings for high-risk items and monthly reviews for the full inventory keep the SOP alive. A process that generates reports nobody reads is a recipe for failure within a quarter.

Define follow-up actions for variance thresholds. If any product exceeds a 3% variance, the SOP should trigger a specific response: re-count, investigate transfers, review POS data, and document findings. That follow-up loop is what turns a written SOP into an operational control system.

What Should a Hotel Bar Inventory SOP Include?

A complete hotel bar inventory SOP should cover six core elements: scope and frequency of counts, receiving and verification procedures, storage and labeling standards, counting methods for both sealed and open containers, transfer and write-off documentation, and a reconciliation and review process.

Each element needs named responsibilities. The SOP should specify who performs each task, who reviews the results, and who has authority to approve write-offs or investigate variances.

Include a training section that defines how new hires learn the process. If the SOP lives only in one manager's head, it breaks the moment that manager calls in sick or transfers to another property.

How Often Should a Hotel Update Its Inventory SOP?

Review your inventory SOP at least twice a year, and update it immediately whenever your operation changes. New outlets, new POS integrations, staff restructuring, and seasonal menu swaps all create gaps in an outdated SOP. According to FSM.How's guide to beverage control, consistent standardization of recipes, measurement, and storage is the foundation of any effective beverage control system.

The review should include a performance check: are variances trending down since the last revision? If not, the SOP itself may need tighter controls on the specific step where losses concentrate.

Assign the SOP review to the same person who owns the weekly count. That person sees the data most frequently and is in the strongest position to identify where the document no longer matches reality.

How Scannabar Helps You Enforce a Hotel Bar Inventory SOP

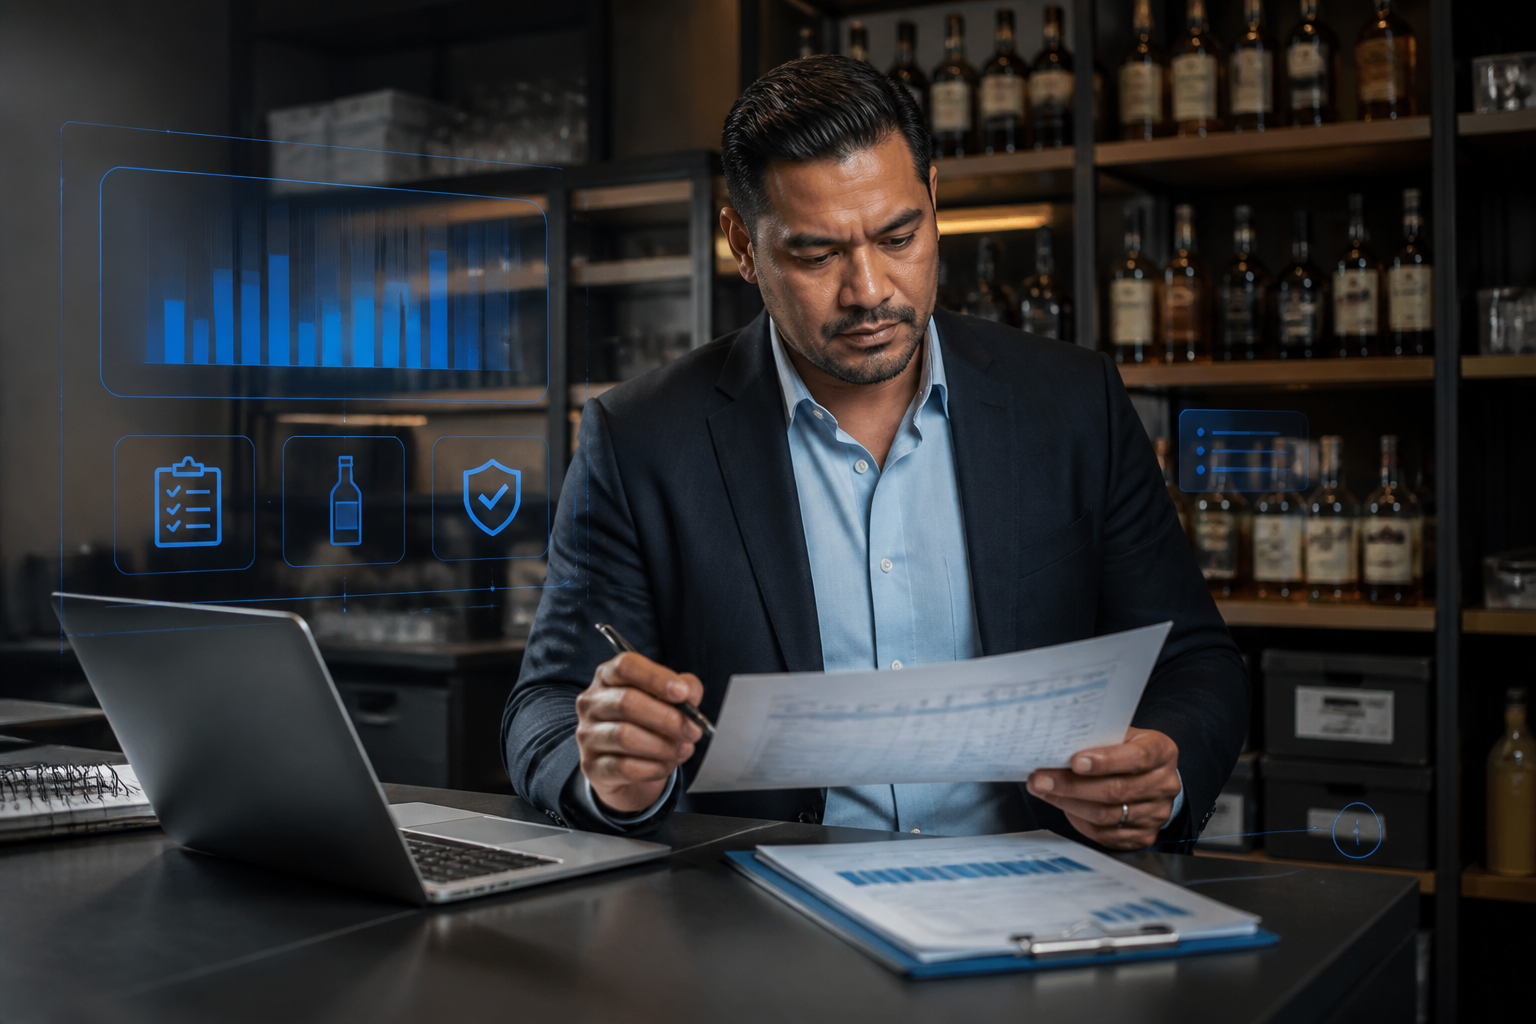
Hotel food and beverage director reviewing inventory reports and SOP performance near the back bar

Scannabar turns a written SOP into a system your team can execute in minutes rather than hours. The Scannabar Inventory Control System uses barcode scanning to measure the exact contents of every bottle, removing the estimation errors that undermine consistency across shifts and outlets.

Because Scannabar integrates with your POS and property management systems, it automatically reconciles physical counts against sales. Variance reports break down discrepancies by product, outlet, and time period, giving your F&B director the data to act on findings the same week they appear.

Hotels running Scannabar routinely operate at 1% to 3% shrinkage, down from the 20% to 25% industry average. You can read more about lowering beverage costs in hotel environments. The system handles receiving logs, transfer records, and open-bottle measurements inside one platform, so every element of your SOP feeds a single source of truth.

Ready to make your SOP enforceable? Call 1-800-939-8960 to talk to someone who has been building hotel inventory systems since 1998.

FAQs About Hotel Bar Inventory SOPs

What is a hotel bar inventory SOP?

A hotel bar inventory SOP is a written procedure that defines how your team receives, stores, counts, and reconciles beverage inventory across every outlet. It standardizes the process so results are consistent regardless of who runs the count or which shift is on duty.

Who should be responsible for the inventory SOP in a hotel?

The bar manager or F&B controller typically owns the SOP. This person ensures counts happen on schedule, reviews variance data, and initiates follow-up when numbers fall outside acceptable thresholds. Scannabar gives that owner real-time visibility into every count across the property.

How long does it take to implement a bar inventory SOP?

Most hotels can draft and deploy a working SOP within two to four weeks. The timeline depends on the number of outlets, the level of staff training required, and whether you are integrating inventory software. Scannabar reduces counting time by up to 75%, which accelerates adoption.

Can a bar inventory SOP prevent theft?

An SOP creates a culture of accountability that makes theft harder to hide. When every bottle is logged at receiving, tracked through transfers, and measured at each count, unexplained losses surface quickly. Scannabar identifies missing bottles at any location within the property, giving managers the data to investigate gaps before they grow.

How does an inventory SOP differ for hotels with banquet operations?

Hotels with banquets need an SOP that accounts for large-volume transfers between storage and event areas. The SOP should include a pre-event pull sheet, a post-event return count, and a reconciliation step that isolates banquet variance from regular bar operations. This prevents event-driven movement from distorting your day-to-day data.

Topics: Hotel Inventory, liquor purchasing, hotel supplies, purchasing, bar inventory app, Hotel Bar Inventory, Best Liquor Inventory app, Scannabar inventory app, Restaurant Inventory app, hotel staff

Inventory Control for Lean Hospitality Teams in 2026

Posted by Nick Kaoukis on Tue, Sep, 15, 2026 @ 11:09 AM

Hospitality manager using barcode scanning to complete inventory checks with a lean team

Running a hospitality operation with fewer people on the floor changes everything about how you manage inventory. Routine counts get pushed back. Variance goes unnoticed for days. Bottles walk out the door, and nobody catches it until the P&L tells the story weeks later.

Scannabar helps bar, restaurant, and hotel operators tighten inventory control so lean teams can protect margins without adding headcount. This article breaks down why staffing shortages create inventory risk, how the right controls reduce labor drag, and why accountability does not have to mean surveillance.

Key Takeaways: Inventory Control for Lean Hospitality Teams

  • Staffing shortages weaken daily control routines, letting small inventory gaps compound into costly patterns over time.
  • Automated inventory checks reduce the labor hours spent on traditional processes, freeing staff for guest-facing tasks.
  • Standardized processes cut training time during high-turnover periods, keeping new hires productive and accurate faster.
  • Scannabar gives operators real-time variance data across bars, restaurants, and hotels from a single system.
  • Clear inventory records protect honest team members from false accusations and surface problems before they become expensive.

Why Staffing Shortages Create Inventory Risk Fast

When you lose a bartender or a shift manager, the first casualty is process. The nightly count gets skipped. The walk-in cooler check happens every other day instead of daily. Par levels stop getting updated because whoever used to do it is gone.

Those gaps look minor in week one. By week four, you are staring at variance you cannot explain. The National Restaurant Association reports that internal factors account for roughly 75% of restaurant inventory shortages. Short staffing makes that number worse because there are fewer eyes on the product and fewer hands doing the work.

For a bar generating $500,000 in annual beverage revenue, even a 3% undetected variance means $15,000 in losses. When teams are stretched thin, that money walks out the door before anyone realizes it is missing.

How Small Inventory Gaps Turn Into Expensive Patterns

A single missed count is a rounding error. A month of missed counts is a pattern your margins cannot absorb. Over-ordering follows because you are replacing bottles you think were sold but were actually lost to waste, spillage, or theft.

Beyond the direct cost, inaccurate inventory creates a cascade of operational problems. Purchasing decisions rely on bad data. Stockouts hit your best-selling items on the busiest nights. Menu profitability reports become fiction.

A BCG and NYU School of Professional Studies analysis found that 65% of North American hotels reported staffing shortages in 2025, with labor costs rising 11.2% year over year. When labor is both scarce and more expensive, the cost of flying blind on inventory compounds faster than most operators realize.

How Automated Inventory Counts Save Labor Hours

Traditional inventory checks eat hours. A bar manager walking the floor with a clipboard, weighing and tallying partial bottles, can spend three to five hours on a single full count. That is three to five hours pulled away from ordering, training, scheduling, and being present during service.

Barcode scanning technology changes the math. A portable scanner reads each bottle in seconds, captures partial contents using a calibrated ruler, and updates your software instantly. This barcode tracking approach replaces the clipboard-and-spreadsheet routine entirely. One operator reported completing inventory for two restaurants, a nightclub, and exterior bars in roughly one hour with a single Scannabar system.

That time savings compounds every count. If you are counting weekly instead of monthly because the process is fast enough to be practical, you catch variance earlier and correct it before it compounds.

Why Standardized Processes Make Training Easier During Turnover

High turnover remains a fact of life in hospitality. Every departure means onboarding someone new, and every new hire opens a window of vulnerability in your inventory process.

When your bar inventory control relies on one person's memory of where everything is and how counts are done, losing that person means starting from scratch. Standardized, system-driven processes eliminate that single point of failure. Proper staff training paired with a repeatable workflow keeps accuracy high regardless of who is on shift.

Scannabar's barcode-driven workflow means the process is the same for a tenured bar manager and a new hire finishing their first week. Scan the tracking label. Scan the UPC. Measure the contents. The software handles the math. That consistency reduces training time and protects accuracy when your roster is changing fast.

How Variance Reporting Prevents Theft Without Creating a Policing Culture

Theft in hospitality is documented and widespread. The National Restaurant Association estimates that employee theft accounts for about 75% of inventory shortages in U.S. restaurants. That is not a number operators can afford to ignore, especially when short staffing reduces oversight.

But catching theft is different from creating a culture of suspicion. The difference comes down to how you surface discrepancies. Variance reports that compare what your POS says you sold against what your shelves actually hold tell an objective story. No accusations. No gut feelings. Just numbers.

When your inventory control system generates automated variance analysis, you see where the gaps are before they grow into patterns. A bottle that does not reconcile after a Tuesday night shift is a conversation, not an investigation. That distinction matters to staff morale and retention.

Hospitality manager reviewing inventory variance data in a calm, organized bar back area

Why Clear Inventory Records Protect Honest Staff Members

Most of your team is not stealing from you. They show up, pour accurately, and handle product with care. When inventory discrepancies surface without documentation, suspicion falls on everyone, and that is corrosive to morale.

A system that tracks every bottle from delivery to depletion creates a clear chain of custody. Honest employees benefit from that transparency because their work is documented and verifiable. When a variance appears, the data points to where and when it happened, removing speculation and false accusations.

Scannabar builds this kind of accountability by assigning each bottle a unique barcode identity and tracking it through its entire lifecycle. That record protects your staff as much as it protects your profits, creating what effective operations teams call a culture of accountability rather than a blame-heavy environment. You can read more about reducing bar shrinkage with structured tracking.

How Scannabar Supports Broad Hospitality Operations

Inventory control challenges are not limited to standalone bars. Hotel bars managing multiple lounges and banquet stations face the same variance and labor pressures at a larger scale. Multi-unit restaurant groups need standardized processes across locations so that inventory data rolls up into meaningful comparisons.

Scannabar is purpose-built for this range of hospitality operations. Whether you operate one neighborhood bar or a resort with multiple beverage outlets including wine programs, the system provides centralized visibility across all locations. Managers see real-time dashboards showing stock levels, pour costs, and variance data without waiting for end-of-month reconciliation.

The system integrates with point-of-sale platforms and property management systems, creating closed-loop tracking from the moment a bottle is received through every pour of your liquor inventory until it is empty. That integration means fewer manual reconciliations and faster detection of discrepancies at any location within your operation.

What Lean Hospitality Teams Gain From Better Inventory Data

When your team is smaller, every hour and every dollar matters more. Reliable inventory data lets you make purchasing decisions based on actual usage patterns instead of estimates and assumptions. Automatic reorder alerts prevent stockouts of your best sellers without requiring someone to manually check par levels.

Velocity reports show which products are moving and which are sitting, helping you adjust your menu mix and negotiate better with suppliers using aggregated purchasing data. These are decisions that directly impact margins, and they become possible only when you trust the numbers behind them.

Scannabar reduces inventory counting time by up to 75% compared to traditional methods, giving your staff more hours to spend on the floor, behind the bar, and in front of guests.

In Conclusion: The Cost of Waiting Is Higher When Teams Are Already Stretched

Staffing shortages are not going away. Labor costs are rising. Every week you operate without reliable inventory control is a week where shrinkage, waste, and theft go undetected. For a lean team, the question is not whether you can afford to invest in inventory control. The question is whether you can afford to keep operating without it.

Scannabar gives hospitality operators the real-time data, automated counts, and variance reporting they need to run tighter operations with fewer people. When your team is already stretched, that visibility is what keeps money from walking out the door.

FAQs About Inventory Control for Lean Hospitality Teams

How does inventory control help hospitality teams with staffing shortages?

Automated inventory systems reduce the hours spent on traditional inventory checks, freeing your remaining staff for guest-facing work. Scannabar cuts counting time by up to 75%, making it practical to count more frequently even with a smaller team.

Can bar inventory control prevent theft without hurting staff morale?

Yes. Variance reports compare actual inventory against POS sales data, surfacing discrepancies objectively. Scannabar frames this as accountability, protecting honest employees while identifying where losses occur.

What types of hospitality businesses benefit from inventory control software?

Bars, restaurants, hotels, nightclubs, country clubs, and multi-unit groups all benefit. Scannabar is designed for operations ranging from a single bar to resorts with multiple beverage outlets and banquet stations.

How quickly can new staff learn to use an inventory control system?

Barcode-driven systems require minimal training. With Scannabar, staff scan a tracking label and a UPC code per bottle. The software handles measurement and reporting, so a new hire can perform accurate counts within their first shift.

What is the financial impact of not having inventory control during staffing shortages?

Bars and restaurants typically lose 20% to 25% of beverage profits to shrinkage. Without regular inventory controls, those losses accelerate during short-staffed periods. Scannabar users have reported reducing liquor shrinkage by over 60% after implementation.

Topics: Restaurant Inventory, liquor theft, Scannabar Inventory system, bar theft, Scannabar inventory app, Resaurant Inventory app, Restaurant Inventory app, Scannabar Inventory Software

How to Cut Hotel Bar Inventory Costs in 2026

Posted by Nick Kaoukis on Sun, Sep, 13, 2026 @ 13:09 PM

Most hotel operators know their beverage program should be profitable. Margins on alcoholic drinks can reach 70% to 80%, making the bar one of the highest-margin departments in any property. Yet too many hotels watch those margins erode month after month. The money is leaving. They just can't see where.

Shrinkage, slow inventory counts, weak reporting, and delayed purchasing decisions all drain revenue at the same time. Scannabar helps hotel and resort operators close those gaps with precise, bar inventory management built for hospitality.

Below, you will find where hotel beverage costs leak and how a structured inventory process puts you back in control.

Hotel bar manager reviewing inventory on a tablet while staff scan labeled bottles in an upscale bar

Key Takeaways: Hotel Bar Inventory Cost Reduction

  • Hotel beverage margins erode through shrinkage, over-pouring, and slow inventory processes that mask real losses.
  • Delayed inventory data forces purchasing decisions based on guesswork, leading to costly overstocking or stockouts.
  • Scannabar reduces inventory counting time by up to 75%, freeing staff to focus on guest service.
  • Real-time variance reports help you spot discrepancies the same day they occur, not weeks later.
  • Hotels that tighten inventory processes can reduce losses faster when issues are identified earlier.

Why Hotel Beverage Costs Rise Faster Than Teams Expect

Hotel bars operate under conditions that amplify loss. Multiple service points, rotating staff, banquet functions, and poolside portable bars all create opportunities for product to leave the building unaccounted for. A single lobby lounge might stock 80 to 120 bottles at any time, and every one of those bottles represents money sitting on a shelf.

According to CBRE's 2025 Trends in the Hotel Industry report, F&B department profit margins for surveyed U.S. hotels reached 29.1% in the first half of 2025. At the same time, Scannabar reports that many operators struggle with shrinkage, waste, and over-pouring that steadily erode those margins.

For a hotel bar generating $500,000 in annual beverage revenue, even a modest loss rate can put tens of thousands of dollars at risk each year.

Where Beverage Margin Slips Away

Shrinkage in a hotel bar rarely comes from one source. Over-pouring is common when bartenders pour without consistent portion standards. Spillage adds up across dozens of drinks per shift. Theft is a documented industry reality. It is not a hypothetical. And it accelerates wherever there is no system tracking individual bottles.

Beyond the bar rail, losses multiply during transfers between storage and service points. A bottle moved from the main storeroom to a banquet station may never get scanned back in. Without perpetual tracking, that bottle simply disappears from your records.

The financial impact cascades from there. You over-order to compensate for phantom shortages. Your pour cost percentage climbs. Your purchasing team cannot see what is actually driving the variance. That is money walking out the door every period.

Why Delayed Inventory Data Hurts Decisions

Many hotel properties still count inventory on a weekly or monthly cycle using clipboard-and-spreadsheet methods. By the time those numbers are compiled, the information is already stale. A variance that appeared during a busy weekend does not surface until the following week, making it difficult to identify which shift or bar station needs attention.

Stale data poisons purchasing decisions. If your Food and Beverage Director places orders based on last month's consumption estimates rather than real-time usage, you end up carrying excess stock on slow-moving SKUs while running short on your highest-velocity items.

That mismatch ties up capital in dead stock, increases waste from expired product, and forces emergency orders at higher prices. None of that shows up on a single invoice. All of it hits your bottom line.

How Scannabar Improves Cost Control Across Hotel Bars

Hospitality operations leader reviewing beverage inventory analytics in a hotel bar back office

Scannabar was built to address exactly these conditions. The system uses barcode scanning technology to track every bottle from the moment it is received to the moment it is fully depleted, giving hotel operators real-time visibility that clipboard-and-spreadsheet methods cannot deliver.

Faster Counts With Better Accuracy

Scannabar measures the contents of approximately 120 bottles in roughly 15 minutes. Compare that to the hours it takes a team to weigh, estimate, and record the same number of bottles by hand.

That speed difference changes hotel operations in practical ways. You can count after every shift if needed, so variances surface immediately instead of hiding inside a monthly spreadsheet. That gives managers clearer control between counts.

Each bottle carries a unique barcode tracking label that ties it to a complete profile including brand, volume, dimensions, and cost. When a bottle goes missing from any location within your property, the Scannabar system flags it automatically.

That level of inventory accountability builds a culture of accountability across your bar team. When staff know every ounce is tracked, over-pouring and unauthorized consumption drop on their own.

Real-Time Reporting for Better Purchasing Decisions

With each scan, Scannabar updates your inventory values instantly and generates real-time reports on usage, variance, and cost. Your F&B Director no longer has to wait until the end of the week to review numbers. Trends become visible the same day they happen, which means purchasing decisions are based on actual consumption rather than estimates.

The system also integrates with your existing point-of-sale setup, creating a closed loop between what is sold and what is poured. When those two numbers do not match, you have a clear starting point for investigation.

That visibility turns your beverage program from a cost center running on gut feel into a profit center driven by real numbers.

How Better Inventory Data Supports Hotel Operations

Tighter inventory controls do more than reduce shrinkage. Purchasing managers can negotiate better supplier pricing because they have aggregated consumption data. Banquet teams can plan beverage packages for events with confidence, knowing exactly what is on hand.

Staff accountability improves as well. You are not playing inventory police. Accurate records protect staff from false accusations and give management the data they need to coach and reward performance.

For multi-property hotel groups, Scannabar provides centralized visibility across locations. A Director of Operations can compare pour costs and variance rates side by side, identifying which properties need attention without waiting for compiled reports.

What Hotel Operators Can Expect From a Stronger Inventory Process

Hotel bar staff member scanning bottles with a handheld device during a fast inventory count

The financial impact can be measurable quickly. Scannabar says clients have reported reducing liquor shrinkage to 1% to 3% from much higher starting points, with beverage cost reductions reported within the first few weeks.

On Scannabar's testimonials page, one nightclub operator reported a 7% reduction in liquor cost across five venues with monthly sales above $250,000.

Beyond the numbers, you gain confidence in your own data. You order what you need, not what you think you need. You catch variances the day they happen, not the month after.

The question for any hotel operator comes down to this. You already know beverage costs are leaking. The only variable is whether you keep absorbing those losses or put a system in place that shows you exactly where every dollar goes. Schedule a live demo and see the difference for yourself.

FAQs About Hotel Bar Inventory Cost

What is a good pour cost percentage for a hotel bar?

Most profitable hotel bars target a pour cost between 18% and 24%, depending on the mix of spirits, wine, and beer they serve. If your pour cost consistently runs above that range, shrinkage, over-pouring, or purchasing inefficiencies are likely factors.

How does Scannabar track individual bottles across multiple hotel bars?

Scannabar assigns each bottle a unique barcode tracking label at the time of receipt. That label follows the bottle through every transfer and service point on your property. If a bottle goes missing from any bar or storage location, the system generates an automatic alert so you can investigate immediately.

How often should a hotel take bar inventory?

Frequency depends on your volume and risk tolerance. With Scannabar, hotel operators can move from weekly or monthly counts to daily or per-shift counts because the process takes minutes rather than hours. More frequent counts catch variances sooner and make it easier to pinpoint the source.

Can Scannabar integrate with hotel property management and POS systems?

Yes. Scannabar integrates with a wide range of point-of-sale platforms used in the hotel industry, including systems from major POS providers. This integration links sales data to inventory data, creating a closed loop that reveals discrepancies between what is sold and what is poured.

What is the fastest way to reduce hotel beverage shrinkage?

Start with accurate, frequent inventory counts and pair them with variance analysis. Scannabar gives you both by scanning your full bottle inventory in minutes and automatically flagging missing product, usage anomalies, and pour cost spikes. Faster visibility helps operators address shrinkage before it becomes routine.

Topics: Bar inventory, Liquor Inventory savings, bar inventory system, bar inventory software, bar inventory app, Best Liquor Inventory app, Cruise ship bar inventory, Country Club Liquor Inventory

From Neighborhood Bars To Hotel Resorts: How Scannabar Helps Hospitality Teams Run Smarter

Posted by Nick Kaoukis on Fri, May, 15, 2026 @ 09:05 AM

Discover how cutting-edge inventory management technology is transforming beverage operations across every corner of the hospitality industry, from cozy local bars to sprawling resort properties.

The Universal Challenge: Beverage Inventory Management Across All Hospitality Venues

Whether you're managing a cozy neighborhood bar or overseeing beverage operations at a luxury resort, one challenge remains constant: keeping track of your liquor inventory. The hospitality industry faces unique complexities when it comes to hospitality inventory management, from shrinkage and over-pouring to manual counting errors and reconciliation headaches. Every establishment, regardless of size, struggles with the same fundamental questions: What's actually on our shelves? Where is our inventory going? And how can we reduce waste while maximizing profitability?

Traditional methods of tracking bottles—clipboards, spreadsheets, and manual counts—simply can't keep pace with the demands of modern beverage programs. These outdated approaches consume valuable staff hours, introduce human error, and provide data that's often days or weeks old by the time it's analyzed. The result? Missed opportunities for cost savings, difficulty identifying theft or over-pouring, and an inability to make data-driven purchasing decisions.The image depicts a sleek modern bar in a luxurious hotel illuminated by soft ambient lighting that highlights a wide array of premium spirits display-1

This is where sophisticated liquor inventory systems come into play. Modern hospitality inventory management solutions are transforming how venues of all sizes track, manage, and optimize their beverage programs. By leveraging technology to automate what was once a tedious manual process, hospitality teams can now gain real-time visibility into their operations, identify issues before they become costly problems, and focus their energy on what matters most: creating exceptional guest experiences.

Streamlining Operations for Neighborhood Bars and Independent Venues

For independent bars and small venues, every dollar counts. Owners and managers often wear multiple hats, juggling everything from staffing and customer service to vendor relationships and financial planning. In this environment, spending hours each week manually counting bottles and reconciling inventory isn't just tedious—it's a significant opportunity cost that takes valuable time away from growing the business.

Scannabar offers neighborhood bars and independent venues a streamlined approach to restaurant inventory control that eliminates the guesswork and manual labor. With intuitive mobile scanning technology, a single staff member can complete a full inventory count in a fraction of the time it would take using traditional methods. Simply scan bottles using a smartphone or tablet, and the system automatically updates inventory levels, calculates variance, and identifies discrepancies.

For smaller operations, the benefits extend beyond time savings. A robust liquor inventory system provides independent venues with professional-grade analytics that were once only accessible to larger operations. Track pour costs by bartender shift, identify your best-performing products, receive alerts when stock levels run low, and gain insights into consumption patterns that inform smarter ordering decisions. This level of visibility helps independent operators compete more effectively, reduce waste, and protect their bottom line.

Perhaps most importantly, implementing a modern inventory management solution allows small business owners to scale their operations confidently. Whether you're considering expanding hours, adding new menu items, or eventually opening a second location, having accurate, real-time data about your beverage program provides the foundation for sustainable growth.

Scaling Smart: How Restaurants and Multi-Location Concepts Leverage Scannabar

As restaurant groups and multi-location concepts grow, the complexity of beverage management grows exponentially. What works for a single location quickly becomes unmanageable across three, five, or ten venues. Different managers may use different processes, making it impossible to compare performance across locations or identify systemic issues. Variance in one location might indicate a training problem, while the same variance elsewhere could signal theft—but without standardized data, these patterns remain invisible.

Scannabar's hospitality inventory management platform is purpose-built for scaling operations. Multi-location concepts gain centralized visibility across their entire portfolio while maintaining the flexibility to manage each location's unique needs. Corporate teams can instantly compare pour costs, inventory turnover, and waste metrics across all venues, identifying best practices at top-performing locations and quickly addressing issues at underperforming sites.

The system's standardized processes ensure consistency across all locations, which is critical for restaurant inventory control at scale. Every manager follows the same inventory procedures, uses the same reporting metrics, and has access to the same analytical tools. This standardization doesn't just improve data quality—it also simplifies training, reduces errors, and makes it easier to transfer knowledge and best practices across the organization.

For restaurant groups, the ability to aggregate purchasing data across multiple locations unlocks significant cost savings. By understanding total consumption across all venues, operators can negotiate better pricing with distributors, optimize order timing to reduce delivery fees, and identify opportunities to standardize their product mix. The result is improved margins without sacrificing the quality or variety that guests expect.

Enterprise-Level Solutions for Hotels and Resort Properties

Hotel and resort properties face beverage management challenges on an entirely different scale. A single resort might operate multiple bars, restaurants, poolside service, room service, banquet operations, and minibar programs—each with its own inventory, staff, and operational requirements. Coordinating inventory across these diverse outlets while maintaining accurate records and preventing loss requires enterprise-grade hospitality inventory management solutions.

Scannabar provides hotels and resorts with the robust infrastructure needed to manage complex, multi-outlet beverage operations. The platform seamlessly integrates with property management systems and point-of-sale platforms, creating a unified ecosystem where data flows automatically between systems. This integration eliminates double-entry, reduces errors, and provides a complete picture of beverage operations across the entire property.

For hotel bar inventory specifically, the system offers sophisticated features designed for high-volume operations. Track transfers between outlets, manage centralized storage facilities, handle special event inventory separately from regular operations, and maintain detailed audit trails for compliance purposes. Real-time reporting allows beverage directors and controllers to monitor performance across all outlets simultaneously, identifying trends and issues as they emerge rather than discovering them weeks later during monthly reconciliation.

Enterprise properties also benefit from Scannabar's advanced analytics and forecasting capabilities. By analyzing historical consumption patterns alongside booking data and event schedules, the system can predict future inventory needs with remarkable accuracy. This predictive capability helps properties optimize stock levels—ensuring they never run out of guest favorites while avoiding the carrying costs and waste associated with overstocking. For large operations where beverage inventory can represent hundreds of thousands of dollars in capital, these optimizations deliver substantial financial benefits.

The scalability of a comprehensive liquor inventory system like Scannabar means it grows alongside the property. Whether managing a boutique hotel with a single bar or a sprawling resort with dozens of beverage outlets, the platform adapts to meet the organization's needs while maintaining the same level of accuracy, insight, and operational efficiency.

Real Results: Time Savings, Cost Reduction, and Profitability Gains

The true measure of any hospitality inventory management solution lies in its tangible impact on operations and profitability. Scannabar users consistently report dramatic improvements across key operational metrics. Inventory counts that once took 6-8 hours can now be completed in under an hour, freeing staff to focus on revenue-generating activities and guest service. This time savings alone often justifies the investment, but it's just the beginning.

Cost reduction represents another significant benefit. By identifying variance quickly and accurately, operators can address over-pouring, waste, and theft before they significantly impact the bottom line. Users typically report reducing their beverage cost percentage by 2-5 points within the first few months of implementation—a substantial improvement in one of hospitality's most challenging cost categories. For a venue with $500,000 in annual beverage sales, a 3-point reduction in pour cost translates to $15,000 in additional profit.

Beyond direct cost savings, the data-driven insights provided by modern restaurant inventory control systems enable smarter business decisions. Operators can identify their most profitable products and promote them more aggressively, eliminate slow-moving inventory that ties up capital, optimize menu pricing based on actual costs, and negotiate more effectively with suppliers using concrete consumption data. These strategic improvements compound over time, creating lasting competitive advantages.

Perhaps most valuable is the peace of mind that comes with accurate, real-time visibility into beverage operations. Operators no longer lie awake wondering where their inventory is going or whether their costs are out of control. With a robust liquor inventory system in place, they have the information they need to manage proactively, address issues quickly, and run their beverage programs with confidence. This operational clarity allows leadership to focus on growth, innovation, and guest experience—the activities that truly drive hospitality success.

From the smallest neighborhood bar to the largest resort property, Scannabar delivers measurable results that transform beverage operations. By combining intuitive technology with powerful analytics, the platform helps hospitality teams at every level run smarter, reduce costs, and maximize profitability—proving that effective inventory management isn't just an operational necessity, it's a strategic advantage.

Topics: liquor inventory, Scannabar Inventory system, liquor control, bar inventory app, liquor inventory app, Best Bar Inventory app, Best Liquor Inventory app, Scannabar inventory app, Restaurant Inventory app, Scannabar Inventory Software

Why Manual Inventory Counts Are Holding Your Bar Back

Posted by Nick Kaoukis on Wed, May, 13, 2026 @ 10:05 AM

Discover how outdated manual inventory practices are costing your bar time, money, and competitive advantage in today's fast-paced hospitality environment.

The Hidden Costs of Counting by Hand

When you think about the cost of manual inventory counts, the first thing that comes to mind is probably labor hours. But the true expense goes far deeper than what you're paying your staff to physically count bottles. Manual inventory counts create a cascade of hidden costs that silently erode your profit margins month after month.Modern Bar with Automated Pour System and Colorful Liquor Display-1

Every hour your bartenders or managers spend counting bottles is an hour they're not engaging with customers, training staff, or focusing on revenue-generating activities. Beyond direct labor costs, manual counts often require you to conduct inventory during off-hours or when the bar is closed, potentially requiring overtime pay or pulling staff away from their primary responsibilities. Additionally, the physical strain of manually counting hundreds of bottles can lead to employee fatigue and burnout, increasing turnover rates in an industry already notorious for staffing challenges.

Perhaps the most insidious hidden cost is the opportunity cost of delayed decision-making. When your inventory data is days or weeks old by the time it's compiled and analyzed, you're essentially flying blind. You might be over-ordering products that aren't selling, missing out on popular items that could drive more revenue, or failing to catch theft and waste until it's too late to intervene. Bar inventory software eliminates these hidden costs by providing accurate, immediate data that empowers better business decisions.

How Human Error Drains Your Bottom Line

No matter how diligent your team is, human error is an inevitable part of manual inventory counts. A bartender counting bottles at the end of a long shift might miscount by a few units here and there, or accidentally skip a shelf entirely. Someone might record a number in the wrong column, transpose digits, or simply misread a label in poor lighting. These small mistakes compound quickly when you're managing hundreds of SKUs across spirits, beer, wine, and mixers.

The financial impact of these errors can be staggering. A study in the hospitality industry found that inventory inaccuracies can cost businesses between 1-3% of their total revenue. For a bar generating $500,000 annually, that's up to $15,000 disappearing due to counting mistakes alone. These errors create false shortages that lead to over-ordering, tying up valuable capital in excess inventory. Conversely, miscounts can result in stockouts of popular items during peak hours, directly impacting customer satisfaction and sales.

Manual inventory counts also make it nearly impossible to identify patterns of theft, over-pouring, or waste. When your baseline data is inaccurate, you can't reliably measure variance or investigate discrepancies. A liquor inventory app eliminates the guesswork by using barcode scanning, weight sensors, or other automated tracking methods that remove human error from the equation. With accurate data, you can finally pinpoint exactly where your inventory is going and take corrective action to protect your profits.

Time is Money: The Productivity Problem

Ask any bar manager how long it takes to complete a full manual inventory count, and you'll likely hear estimates ranging from 3 to 8 hours, depending on the size of the establishment. For many bars, this means dedicating an entire shift to inventory—typically after closing when staff are already exhausted. The process is tedious: walking through storage areas, counting bottles, recording numbers on clipboards or spreadsheets, then manually entering all that data into a computer system for analysis.

This time investment represents a massive drain on productivity and operational efficiency. Consider that most bars should be conducting inventory at least weekly, if not more frequently, to maintain accurate stock levels and quickly identify issues. That's potentially 32 hours per month dedicated solely to counting—time that could be spent improving bar operations efficiency through staff training, menu development, marketing initiatives, or simply providing better customer service during operating hours.

The productivity problem extends beyond the counting process itself. Once the manual count is complete, someone still needs to compile the data, calculate variances, identify reorder points, and generate reports for management review. This additional administrative work can add several more hours to the process. Modern bar inventory software reduces a task that once took hours down to mere minutes. With mobile apps that enable quick scanning and automatic calculations, your team can complete accurate inventory counts in a fraction of the time, freeing them up to focus on what really matters: creating exceptional experiences for your guests and growing your business.

Missing Out on Real-Time Data Insights

In today's data-driven business environment, making decisions based on week-old information is like driving while looking in the rearview mirror. Manual inventory counts are inherently backward-looking, providing a snapshot of what your stock levels were days ago rather than what they are right now. By the time you've completed your count, entered the data, and generated reports, the information is already outdated, and market conditions may have shifted dramatically.

Without real-time data insights, you're unable to respond quickly to emerging trends or sudden changes in demand. You can't immediately identify which cocktails are driving the most profit, which bottles are moving slowly and tying up capital, or which suppliers are consistently delivering quality products on time. You're also missing the ability to track pour costs accurately, compare actual usage against sales data to identify discrepancies, or monitor staff performance metrics that could reveal training opportunities or theft.

Bar inventory software transforms your operation from reactive to proactive by providing instant access to critical business intelligence. Real-time dashboards show you at a glance which items are running low, what your current pour costs are across different categories, and how today's sales compare to previous periods. You can set automatic reorder alerts so you never run out of best-selling items, track trends over time to optimize your menu offerings, and make data-driven purchasing decisions that maximize profitability. This level of insight simply isn't possible with manual inventory counts, putting bars that rely on outdated methods at a significant competitive disadvantage in an increasingly sophisticated market.

Making the Switch to Automated Inventory Management

Transitioning from manual inventory counts to automated systems might seem daunting, but the process is more straightforward than many bar owners imagine. Modern bar inventory software is designed with user-friendliness in mind, offering intuitive interfaces that require minimal training. The first step is selecting a solution that fits your specific needs—whether that's a comprehensive system that integrates with your POS and accounting software, or a streamlined liquor inventory app focused solely on tracking bottles and generating reports.

Implementation typically begins with an initial setup phase where you'll catalog all your products into the system, establish par levels for each item, and configure integrations with existing tools. Many software providers offer onboarding support to help you through this process, ensuring data accuracy from day one. Once configured, your staff can begin using mobile devices to scan barcodes or quickly input inventory levels, with the system automatically calculating variances, suggesting reorder quantities, and flagging potential issues for investigation.

The return on investment for bar inventory software is typically realized within just a few months. The combination of time savings, reduced errors, prevention of theft and waste, and optimized purchasing decisions creates multiple revenue streams that quickly offset the software subscription costs. Beyond the financial benefits, you'll notice improvements in staff morale as employees are freed from the tedium of manual counting, better supplier relationships through more accurate and timely ordering, and enhanced overall bar operations efficiency that positions your establishment for sustainable growth. The question isn't whether you can afford to invest in automated inventory management—it's whether you can afford to keep falling behind competitors who have already made the switch.

Topics: Bar inventory, free pour, Scannabar Inventory system, NightClub Management, Reducing Liquor Costs, Best Bar Inventory app, Best Liquor Inventory app, Cruise ship bar inventory, Country Club Liquor Inventory, Scannabar inventory app, Restaurant Inventory app, Scannabar Inventory Software

Waste Reduction Strategies to Boost Your Bar's Profit Margins

Posted by Nick Kaoukis on Mon, May, 11, 2026 @ 09:05 AM

Discover how cutting waste in your bar operation can transform spillage and spoilage into serious profits while creating a more sustainable business.

The Hidden Costs Draining Your Bar's Bottom Line

Every bar owner knows that profit margins can be razor-thin in the hospitality industry, but many don't realize just how much waste is silently eating away at their bottom line. From over-pouring and spillage to expired inventory and theft, the hidden costs of poor liquor inventory control can cost bars 20-25% of their total beverage revenue annually. These losses often go unnoticed because they happen in small increments throughout each shift, making them difficult to track without proper systems in place.

The most significant culprits include over-pouring by bartenders who eyeball measurements, spillage during busy service periods, spoilage from ingredients that expire before use, and unaccounted-for drinks that disappear through theft or unauthorized giveaways. When you consider that the average bar pours hundreds of drinks per week, even a quarter-ounce of excess per cocktail adds up to thousands of dollars in lost revenue over a year. Understanding these hidden costs is the first step toward implementing effective liquor inventory control and improving your bar profit margins.Modern Bar with TechIntegrated Cocktails and Vibrant Atmosphere

Beyond the direct financial impact, waste also affects your cost of goods sold (COGS), making it harder to accurately price your menu items and forecast purchasing needs. Many bar owners operate with beverage cost percentages that are 5-10% higher than they should be simply because they're not accounting for all the waste in their system. By identifying and quantifying these hidden costs, you can establish a baseline for improvement and set realistic targets for beverage cost reduction.

Smart Inventory Management Systems That Stop Money From Pouring Down the Drain

Implementing robust liquor inventory control through modern bar inventory software has become essential for bars serious about protecting their profit margins. These digital solutions replace outdated manual counting methods with streamlined systems that track every bottle from delivery to the last pour. Bar inventory software allows you to conduct regular inventory counts in a fraction of the time, compare actual usage against sales data, and quickly identify discrepancies that signal potential problems like theft, over-pouring, or recording errors.

The key to effective inventory management is consistency and frequency. Leading bars now conduct inventory counts at least weekly, with many high-volume establishments doing spot checks on premium bottles daily. Modern bar inventory software makes this practical by using barcode scanning or bottle weighing technology that reduces counting time by up to 75%. These systems automatically calculate variance reports, showing you exactly where your liquor is going and highlighting products with unusual depletion rates that deserve closer attention.

Beyond tracking, smart inventory systems help optimize your purchasing decisions and reduce over-ordering that leads to spoilage. By analyzing historical sales patterns and current stock levels, bar inventory software can generate suggested order lists that ensure you have enough inventory to meet demand without tying up excessive capital in bottles that sit on shelves. This targeted approach to purchasing is a powerful beverage cost reduction strategy that prevents both stockouts and waste from expired perishables.

Integration capabilities make modern inventory systems even more powerful. When your bar inventory software connects with your point-of-sale system, it creates an automatic feedback loop that tracks theoretical usage based on recipes against actual depletion. This variance analysis quickly reveals whether your staff is following standard recipes, whether theft is occurring, or whether your recipes need adjustment. The data-driven insights these systems provide transform liquor inventory control from guesswork into a precise science that directly improves bar profit margins.

Portion Control Techniques That Maintain Quality While Maximizing Profits

Consistent portion control is one of the most effective beverage cost reduction strategies available to bar owners, yet it's frequently overlooked or inconsistently applied. The difference between a 1.5-ounce pour and a 2-ounce pour might seem negligible on a single drink, but across hundreds of cocktails per week, that extra half-ounce represents significant profit loss. Implementing strict portion control measures ensures that every drink meets your cost targets while maintaining the consistency that keeps customers coming back.

Measured pourers and jiggers are the foundation of effective portion control. Free-pouring might look impressive, but even experienced bartenders can vary by 0.25 to 0.5 ounces per drink, especially during high-volume periods. Installing measured pourers on your liquor bottles guarantees that every shot is exactly the size you've designed your recipes around. For establishments that prefer the aesthetics of free-pouring, training bartenders to use jiggers consistently is essential. Regular pour tests, where managers check bartender accuracy with marked shot glasses, help maintain standards and identify team members who need additional training.

Recipe standardization goes hand-in-hand with portion control. Every cocktail on your menu should have a documented recipe with exact measurements for each ingredient. These standardized recipes become the foundation of your liquor inventory control system, allowing you to calculate theoretical usage and identify variances. When everyone follows the same recipe, you ensure consistent quality, accurate costing, and better inventory tracking. Many successful bars post laminated recipe cards at each station or use tablets with recipe apps to make it easy for bartenders to follow specifications exactly.

Portion control tools extend beyond pourers to include garnishes and mixers, which can also impact your bar profit margins. A heavy hand with expensive garnishes like fresh herbs or specialty bitters adds up quickly. Similarly, over-pouring mixers dilutes your cocktails and increases costs. By establishing clear standards for every element of your drinks and providing your team with the tools to execute consistently, you create a culture of precision that protects your margins while ensuring every guest receives the same high-quality experience.

Turning Food and Beverage Waste Into Creative Menu Opportunities

Progressive bar operators are discovering that effective liquor inventory control isn't just about preventing waste—it's also about creatively repurposing ingredients that might otherwise be discarded. This approach to beverage cost reduction transforms potential losses into profitable menu items while demonstrating environmental responsibility that resonates with modern consumers. By viewing surplus or aging inventory as an opportunity rather than a problem, you can create unique offerings that differentiate your bar from competitors.

Fruit and herb garnishes that are approaching the end of their freshness can be repurposed into house-made syrups, shrubs, and infusions that add complexity to your cocktail program. Citrus peels become oleo saccharum or dehydrated garnishes, while slightly wilted herbs can be muddled into specialty drinks or steeped into simple syrups. These value-added preparations not only reduce waste but also allow you to create signature ingredients that can't be easily replicated elsewhere, giving your bar a unique identity and justifying premium pricing.

Slow-moving spirits present another opportunity for creative menu development. Rather than watching premium bottles gather dust, feature them in limited-time cocktails or create a rotating "bartender's choice" program that highlights underutilized inventory. Many bars successfully use flight programs or tasting menus to introduce customers to slow-moving products, often discovering that certain items just need better promotion rather than being poor performers. This proactive approach to liquor inventory control prevents the write-offs that occur when bottles expire or become unsellable.

Consider implementing a zero-waste cocktail program that makes creative use of every ingredient. Juice pulp becomes ingredients in house-made sodas or is incorporated into food menu items. Coffee grounds from espresso martinis can be repurposed into coffee liqueur infusions. Even egg whites left over from yolk-forward dishes can be used in sours and fizzes. By systematically identifying waste streams and brainstorming creative applications, you engage your team in improving bar profit margins while building a reputation for innovation and sustainability that attracts environmentally conscious customers.

Training Your Team to Become Waste Reduction Champions

Even the most sophisticated bar inventory software and waste reduction systems will fail without buy-in from your team. The bartenders, barbacks, and servers who handle your inventory daily are your frontline defense against waste, and their habits directly impact your bar profit margins. Creating a culture where every team member understands the financial impact of waste and takes ownership of inventory control transforms your entire operation from reactive to proactive.

Start by making the business case transparent. Many bartenders don't realize that over-pouring a half-ounce on each drink in a busy Saturday night shift can cost the bar hundreds of dollars. Share the numbers with your team—show them how waste impacts profitability and, ultimately, their job security and tip potential. When staff understand that better liquor inventory control means a healthier business that can afford competitive wages and stay open long-term, they become invested in the outcome. Consider implementing incentive programs that reward teams for hitting variance targets or reducing beverage costs, creating positive motivation for careful inventory practices.

Comprehensive training programs should cover all aspects of beverage cost reduction, from proper pouring techniques and recipe adherence to inventory handling and storage procedures. Hands-on practice with jiggers and pourers helps bartenders develop muscle memory for accurate measurements. Role-playing scenarios where staff identify potential waste situations and discuss solutions builds problem-solving skills. Regular refresher training ensures that standards don't slip over time and gives you opportunities to introduce new techniques or address emerging issues. Documentation of all procedures creates a training resource for new hires and a reference for experienced staff.

Empowerment is the final piece of effective team training. Encourage staff to identify waste sources and suggest improvements—they often spot inefficiencies that management overlooks. Create a system where team members can easily report problems like leaking bottles, malfunctioning equipment, or recipe issues that lead to waste. Regular team meetings focused on inventory results foster accountability and allow for collaborative problem-solving. When bartenders feel like partners in the business rather than just employees, they naturally take more care with inventory and become genuine champions of waste reduction.

Tracking individual performance through your bar inventory software can also support training efforts. When you can show a bartender that their station has higher variance than others, it creates a concrete learning opportunity. Similarly, recognizing team members who consistently maintain tight inventory control reinforces positive behavior. By combining education, accountability, and recognition, you build a team culture where liquor inventory control becomes second nature, protecting your bar profit margins while elevating the professionalism of your entire operation.

Topics: Bar inventory, Hotel Inventory, wine inventory, managing liquor inventory cost, Liquor cost, Liquor Inventory savings, wine inventory app, wine inventory solution, wine inventory system, warehouse inventory

From Bottle To Bottom Line: How Better Inventory Tracking Improves Beverage Profitability

Posted by Nick Kaoukis on Fri, May, 08, 2026 @ 09:05 AM

Discover how implementing smart inventory tracking systems can transform your bar or restaurant's beverage program from a profit drain into a revenue powerhouse.

The Hidden Costs Lurking Behind Your Bar

Walk into any bar or restaurant, and you'll see bottles lined up neatly on shelves, carefully arranged for both aesthetics and accessibility. But beneath that polished surface lies a profit-draining reality that most owners don't fully grasp: beverage inventory shrinkage represents one of the most significant, yet least visible, drains on profitability in the hospitality industry. Industry studies consistently show that bars and restaurants lose between 20-25% of their beverage revenue to various forms of waste, theft, over-pouring, and tracking errors.Bartender Crafting Cocktail at Trendy Bar

These hidden costs manifest in multiple ways. Over-pouring by well-intentioned bartenders can add up to thousands of dollars monthly. A heavy-handed pour that gives customers 1.75 ounces instead of the standard 1.5 ounces represents a 17% loss on every drink. Multiply that across hundreds of drinks per night, and the numbers become staggering. Then there's the spillage during busy service, the drinks that get remade due to customer complaints, and the bottles that mysteriously disappear during inventory counts.

Perhaps most insidious is the phenomenon of 'ghost inventory'—products you think you have but actually don't. Without accurate real-time tracking, managers order based on faulty data, leading to emergency orders at premium prices, stockouts of popular items during peak service, and capital tied up in slow-moving inventory. The result is a vicious cycle where profitability steadily erodes while owners struggle to identify exactly where the leaks are occurring.

Why Traditional Counting Methods Are Costing You Thousands

The weekly or monthly ritual of manual inventory counting is familiar to anyone who's managed a bar: staff members with clipboards, counting bottles, estimating partial fills, and spending hours tallying numbers. This time-honored tradition, while well-intentioned, is fundamentally flawed in ways that directly impact your bottom line. Human error is inevitable when counting hundreds of SKUs, especially after a long shift. Studies show that manual inventory counts typically have an error rate of 5-10%, which might not sound like much until you calculate what that means for a bar doing $50,000 in monthly beverage sales.

The infrequency of traditional counting creates another critical problem: by the time you identify a variance, the opportunity to address it has passed. If you count on the first of the month and discover significant shrinkage, you have no way of knowing whether the loss occurred during week one, two, three, or four. Was it a specific bartender's shift? A particular busy weekend? A delivery discrepancy? Without real-time data, these questions remain unanswered, and the problematic behaviors continue unchecked.

Traditional methods also fail to capture velocity data that's essential for smart purchasing and pricing decisions. You might know you go through ten bottles of a premium vodka per month, but do you know which days of the week drive that consumption? Which bartenders sell it most effectively? What mixers pair with it most frequently? This contextual information is gold for optimizing your beverage program, but clipboard counting simply can't capture it. The opportunity cost of these blind spots represents thousands in unrealized profit potential.

Smart Technology Solutions That Pay For Themselves

Modern inventory tracking technology has revolutionized beverage management, with solutions like Scannabar leading the charge by transforming how establishments monitor and optimize their bar operations. These systems leverage barcode scanning, weight sensors, and cloud-based analytics to provide real-time visibility into every aspect of beverage inventory. Instead of spending hours counting bottles, staff can scan items in seconds, automatically updating inventory levels, tracking consumption patterns, and flagging variances instantly.

The return on investment for these systems is remarkably fast. Consider a typical scenario: a mid-sized restaurant with $30,000 in monthly beverage sales experiencing the industry-average 23% shrinkage is losing $6,900 per month. Implementing a comprehensive tracking system like Scannabar typically costs between $200-500 monthly, depending on the size and complexity of the operation. If the system reduces shrinkage by even half—bringing it down to 11.5%—the establishment recovers $3,450 monthly while investing just a fraction of that in the technology. That's a payback period measured in weeks, not years.

Beyond direct shrinkage reduction, smart tracking systems deliver multiple additional benefits that compound profitability. Automated par level alerts prevent stockouts of high-margin items and eliminate emergency orders at premium prices. Detailed consumption analytics reveal which products drive the most profit per square inch of shelf space, enabling data-driven menu optimization. Integration with POS systems creates accountability by comparing sales data with pour data, identifying discrepancies immediately. Some establishments report that the accountability factor alone—simply letting staff know everything is tracked—reduces variance by 15-20% within the first month of implementation.

The technology also transforms purchasing from a reactive scramble into a strategic advantage. With accurate velocity data and predictive analytics, managers can negotiate better pricing through optimized order timing and quantities. They can identify slow-moving inventory before it becomes dated or expired, implement early promotional pricing to move it, and make room for higher-margin alternatives. These incremental improvements across dozens of line items create a cumulative effect that significantly enhances overall beverage profitability.

Real-World Success Stories: Restaurants That Increased Profit Margins

The theoretical benefits of better inventory tracking become tangible when examining real-world implementations. A mid-sized gastropub in Portland, Oregon, implemented comprehensive beverage tracking after years of frustration with inconsistent margins. Within 90 days, they documented a 19% reduction in beverage costs as a percentage of sales. The system quickly identified that their craft cocktail program—previously thought to be highly profitable—was actually underperforming due to over-pouring of premium spirits and inconsistent recipe execution. With real-time tracking and staff accountability, they standardized recipes, reduced waste, and increased their cocktail program's contribution margin by 12 percentage points.

A restaurant group operating five locations across the Southwest implemented Scannabar's tracking system chain-wide and discovered significant location-to-location variances that manual counting had never revealed. Their highest-volume location was actually their least profitable from a beverage perspective, with shrinkage rates nearly double the company average. The tracking data pinpointed specific shifts and service periods where losses concentrated, leading to targeted training and management changes. Within six months, they brought that location's performance in line with company standards, effectively recovering over $4,000 monthly in previously lost revenue from just that one site.

Perhaps most compelling is the story of an upscale hotel bar that struggled with premium spirit inventory management. With hundreds of high-value bottles—some costing $200-500 per bottle—even small variances represented substantial losses. After implementing smart tracking technology, they discovered that nearly 30% of their shrinkage came from just 15 SKUs, all premium offerings. The visibility allowed them to implement bottle-level security measures for those specific items, create special handling protocols, and use data to identify when consumption patterns deviated from sales data. The result was a 27% reduction in total shrinkage and a complete transformation of their premium spirits program from a loss leader to a profit center, adding over $35,000 annually to their bottom line.

Building Your Action Plan For Better Beverage Management

Transforming your beverage operation starts with acknowledging where you currently stand. Begin by conducting a comprehensive audit of your existing inventory practices. How often do you count? What's your current variance rate? How long does the counting process take, and what's the labor cost associated with it? Document your current beverage cost percentage and establish baseline metrics. Many operators resist this step because confronting the reality can be uncomfortable, but you can't improve what you don't measure.

Next, evaluate technology solutions based on your specific operational needs. Not all establishments require the same level of sophistication. A high-volume nightclub with hundreds of transactions per hour has different requirements than a wine-focused restaurant with a curated selection. Look for systems that integrate with your existing POS, offer intuitive interfaces that won't require extensive training, and provide the specific analytics most relevant to your operation. Request demos, talk to current users in similar operations, and pay particular attention to ongoing support and training offerings. The best technology is worthless if your team won't use it consistently.

Implementation success depends heavily on change management and team buy-in. Introduce the new system transparently, explaining that the goal is operational improvement, not catching staff doing something wrong. Involve your bartenders and servers in the process, soliciting their input on pain points in the current system and features they'd find valuable. Create clear protocols for how and when tracking occurs, integrate it seamlessly into existing workflows, and celebrate early wins. When staff see how accurate data helps them manage their sections better, prevents embarrassing stockouts, and creates fair accountability, resistance typically transforms into advocacy.

Finally, commit to using the data the system generates. The most sophisticated tracking solution provides no value if the resulting insights don't drive decisions. Establish a regular cadence—weekly is ideal—for reviewing key metrics: shrinkage rates, velocity by category, variance by shift or bartender, and margin performance by item. Use these insights to refine your beverage menu, adjust pricing, optimize purchasing, and provide targeted coaching. Track your improvement over time, quantifying the financial impact. Most operators who fully embrace data-driven beverage management report that within six months, they can't imagine running their operation any other way—the visibility and control become indispensable tools for protecting and growing profitability.

Topics: bar inventory app, liquor inventory app, Best Bar Inventory app, Best Liquor Inventory app, wine inventory app, Scannabar inventory app, Resaurant Inventory app, Restaurant Inventory app

Boosting Bar Inventory Accuracy with Scannabar

Posted by Nick Kaoukis on Mon, Apr, 27, 2026 @ 09:04 AM

Modern Bar with TechIntegrated Cocktails and Vibrant AtmosphereDiscover how Scannabar's cutting-edge technology eliminates costly inventory errors and transforms bar management into a streamlined, profit-boosting operation.

The Hidden Costs of Inaccurate Bar Inventory

As a bar manager, I've seen firsthand how inventory inaccuracies can silently drain profits from even the most successful establishments. Every missed bottle, over-poured drink, or miscounted stock item represents money walking out the door. The average bar loses between 20-25% of its profits due to inventory shrinkage, theft, and poor management practices. These aren't just numbers on a spreadsheet—they're real dollars that could be reinvested in your business, your staff, or your bottom line.

Beyond the direct financial losses, inaccurate inventory creates a cascade of operational problems. You might run out of popular items during peak hours, disappointing customers and losing sales. Over-ordering leads to expired products and wasted capital tied up in excess stock. Your staff wastes valuable time manually counting bottles and reconciling discrepancies, time they could spend providing exceptional customer service. The stress and guesswork of traditional inventory methods also contribute to staff burnout and turnover.

Perhaps most damaging is the inability to make informed business decisions. Without accurate data, you're flying blind when it comes to pricing strategies, menu optimization, and vendor negotiations. You can't identify your most profitable items or spot trends before they impact your revenue. In today's competitive hospitality landscape, operating without precise inventory insights isn't just inefficient—it's a recipe for failure.

How Scannabar Revolutionizes Inventory Management

After struggling with traditional inventory methods for years, I discovered Scannabar, and it completely transformed how we manage our bar operations. Unlike conventional systems that rely on manual counting and clipboards, Scannabar uses cutting-edge barcode scanning technology paired with intelligent software that was specifically designed for the unique challenges of bar inventory management. The system recognizes thousands of products instantly, eliminating the tedious task of manually recording each bottle.

What sets Scannabar apart from other inventory solutions is its intuitive design built by people who actually understand bar operations. The mobile app integrates seamlessly with your existing POS system, creating a unified ecosystem that tracks every pour from purchase to sale. The learning curve is minimal—my team was up and running within a single shift. The interface is clean, fast, and designed for the fast-paced bar environment where every second counts.

Scannabar also provides powerful analytics and reporting features that give managers unprecedented visibility into their operations. Customizable dashboards show real-time data on pour costs, velocity reports, variance analysis, and profitability by item. You can instantly see which cocktails are your best performers and which ingredients are disappearing faster than they should. The system generates automated reports that used to take hours to compile manually, freeing up management time for more strategic activities.

Real-Time Tracking That Puts Money Back in Your Pocket

The game-changer with Scannabar is the real-time visibility it provides into your inventory. Instead of discovering discrepancies days or weeks later during a manual count, you know exactly what's happening in your bar at any given moment. When a bottle is scanned into inventory, it's immediately reflected in the system. When it's poured and rung through your POS, the system automatically updates. This continuous monitoring creates an unprecedented level of accountability and control.

Real-time tracking has directly improved our profit margins in measurable ways. We've reduced our pour cost by 3-4 percentage points since implementing Scannabar, which translates to thousands of dollars monthly. We can now identify discrepancies immediately and address them before they become major losses. If a bottle goes missing or there's an unusual variance, we know about it right away—not at the end of the month when memories have faded and the trail has gone cold.

The financial benefits extend beyond just preventing losses. With accurate, real-time data, we've optimized our ordering processes to maintain ideal stock levels—enough to meet demand without tying up excessive capital in inventory. We've negotiated better pricing with vendors because we have precise data on our consumption patterns. We've also used the insights to redesign our menu, promoting high-margin items and eliminating underperformers. These strategic decisions, powered by Scannabar's real-time data, have significantly improved our overall profitability.

Reducing Waste and Preventing Theft with Smart Technology

One of the most powerful aspects of Scannabar is how it naturally reduces both waste and theft without creating an oppressive workplace environment. The simple knowledge that every bottle is tracked and every variance is visible creates a culture of accountability. Staff members know their pours are monitored, which dramatically reduces over-pouring and unauthorized drinks. We've seen our liquor shrinkage drop by over 60% since implementation—and we accomplished this without becoming the inventory police.

The system's variance reports are particularly valuable for identifying patterns that indicate problems. If a particular bartender consistently shows higher variance on premium spirits, we can provide targeted training or investigate further. If waste is unusually high during certain shifts, we can examine what's happening during those times. This granular visibility allows us to address issues professionally and constructively rather than making blanket accusations that damage morale.

Scannabar also helps us minimize waste from expired products and over-ordering. The system alerts us when items are approaching their expiration dates, so we can feature them in promotions or rotate stock appropriately. The historical data helps us forecast demand more accurately, so we're not stuck with cases of seasonal items that don't sell. We've reduced our inventory waste by approximately 40%, which not only saves money but also aligns with our sustainability commitments. In an industry where margins are tight, eliminating this waste has been a significant competitive advantage.

Implementing Scannabar for Maximum ROI

Based on my experience implementing Scannabar across multiple locations, I can confidently say the key to maximum ROI is proper onboarding and team buy-in. Start by clearly communicating to your staff why you're implementing the system—frame it as a tool that makes their jobs easier and protects them from false accusations, not as a surveillance mechanism. Involve your key team members in the setup process so they feel ownership over the new system. Scannabar's customer support team is exceptional and will guide you through the initial setup, but internal champions make all the difference in long-term adoption.

During the first few weeks, focus on consistency rather than perfection. Make scanning every bottle a non-negotiable habit, even if the process feels slow initially. Schedule brief daily check-ins to review the data with your team, celebrating successes like reduced variance and using discrepancies as learning opportunities. As your team becomes comfortable with the basic functions, gradually introduce the more advanced features like custom reports and automated alerts. This phased approach prevents overwhelm and builds confidence.

The financial return on investment speaks for itself. Most bars see the system pay for itself within 2-3 months through reduced shrinkage alone—everything after that is pure profit improvement. Beyond the direct cost savings, consider the value of the time you'll save on inventory counts, the strategic insights that drive better business decisions, and the peace of mind from knowing exactly what's happening in your bar. After using Scannabar for over two years, I can't imagine managing a bar without it. It's not just better than other inventory systems—it's in a completely different league. If you're serious about profitability and operational excellence, Scannabar isn't just a good choice; it's the only choice.

Topics: Restaurant Inventory, Scannabar Inventory system, Best Bar Inventory app, Best Liquor Inventory app, Cruise ship bar inventory, Country Club Liquor Inventory, Scannabar inventory app, Resaurant Inventory app, Restaurant Inventory app, Scannabar Inventory Software