

Liquor inventory control connects stock counts, receiving records, transfers, recipes, and sales so you can understand what your beverage operation consumed and what that consumption cost. Cost control uses those records to guide pricing, purchasing, portion standards, and corrective action.
Scannabar supports liquor inventory control with barcode-enabled inventory measurement and usage reporting. This guide explains the operating process behind the reports, including how to calculate costs and investigate discrepancies without turning a number into an unsupported accusation.
Use the sections as a reference for your bar, restaurant, or hotel. The four companion articles provide deeper calculations and worksheet examples; this guide shows how their subjects fit together into a repeatable management routine.
Key Takeaways: Liquor Inventory and Cost Control
- Reliable liquor inventory starts with documented receiving, stock movements, and consistent counts across every location included in your reporting scope.
- Calculate liquor cost from inventory consumed and matching sales, using the same dates, categories, and valuation policy for both inputs.
- Set cost targets from your recipes and revenue mix instead of treating an industry average as a diagnosis for your bar.
- Scannabar supports barcode-enabled inventory measurement and product-level reporting that help you review the evidence behind stock and usage discrepancies.
- Reconcile count errors, purchasing records, transfers, waste, and recipe mapping before drawing conclusions about the cause of unexplained beverage variance.
What Is Liquor Inventory Control?
Liquor inventory control accounts for stock entering, moving through, and leaving your operation. It connects a physical count with the records that explain what changed between counts.
Buying and selling records alone cannot establish consumption. Some purchases remain on the shelf, some stock moves to another outlet, and some product is consumed without an ordinary sale. Opening and closing counts establish the boundaries for reviewing those movements.
Your objective is a traceable record of stock and usage. That record supports purchasing decisions, financial reviews, and operational investigations. It also protects staff from being blamed for discrepancies that originate in incomplete records or inconsistent measurements.
Define the Inventory Scope Before Counting
Inventory scope specifies the locations, categories, and dates covered by your review. Document those boundaries before your first count so receiving and sales records can be matched to the same operation.
A hotel-wide report may include a central storeroom, restaurant, lobby bar, and banquet operation. An outlet report includes only its assigned stock. Transfers between included locations cancel at property level but must be recorded for each outlet.
Define spirits, wine, beer, and other ingredients consistently. A spirits-only cost calculation should not use all restaurant sales as its denominator. Mixing categories can make a ratio look favorable while concealing the economics of the category you intended to review.
Build a Reliable Liquor Inventory Process
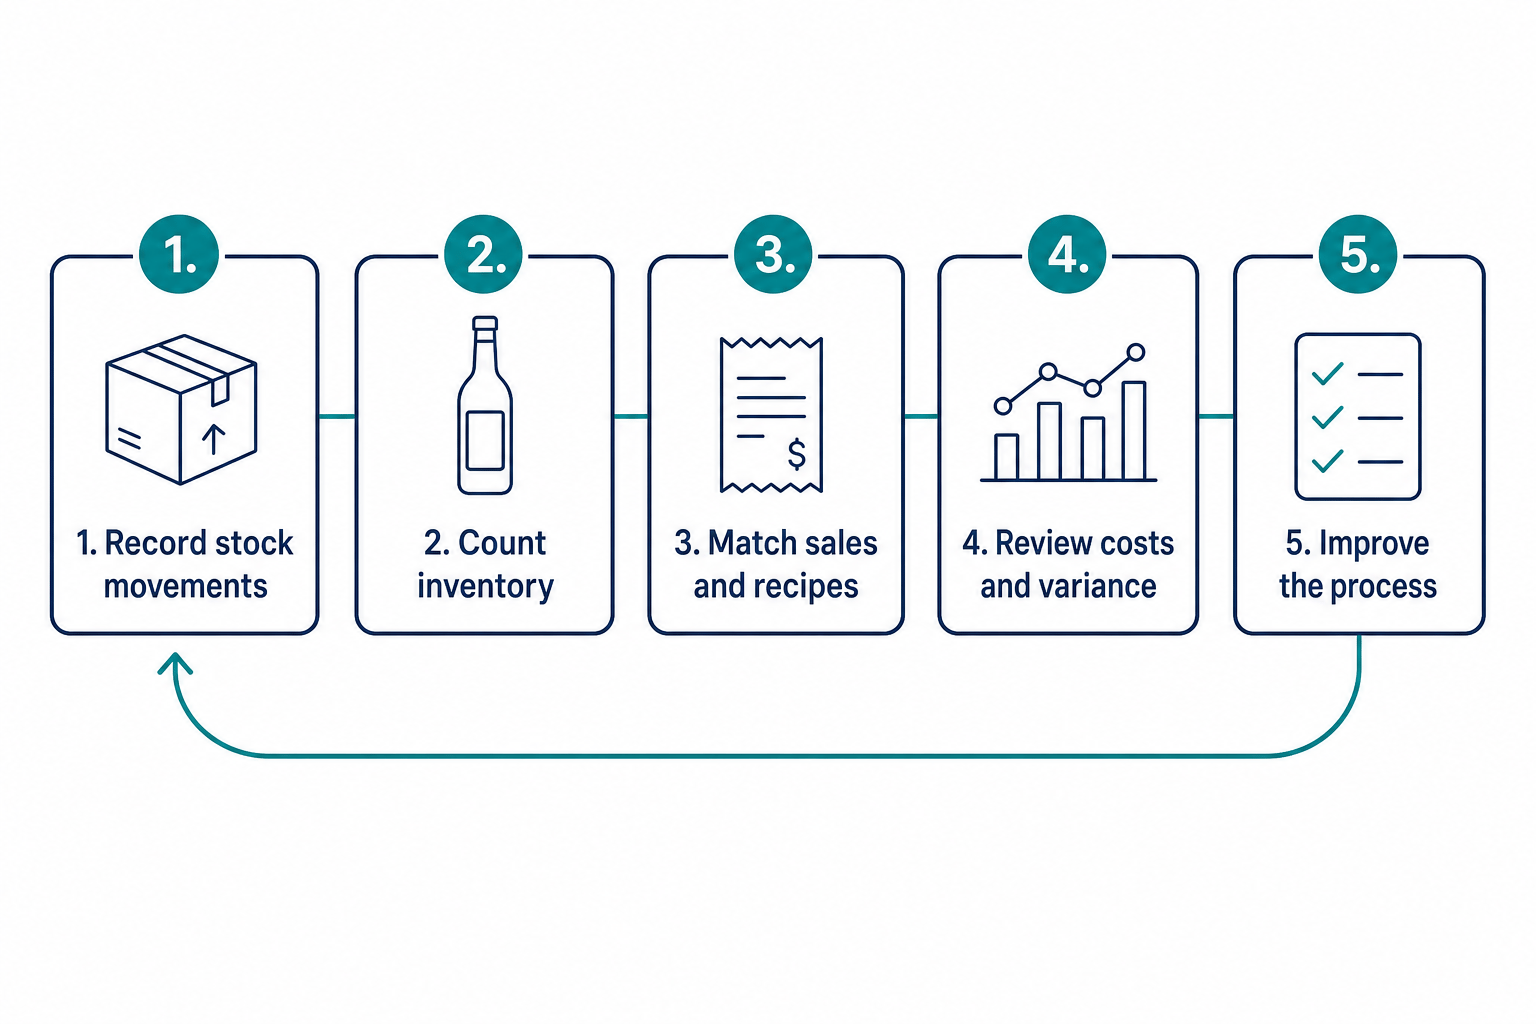
A reliable liquor inventory process records stock movements, measures opening and closing quantities, and reconciles usage against matching sales. Assign ownership for each step and document how exceptions are handled.
Your process should remain consistent when staff change. A written routine, named reporting locations, standardized units, and retained count records make periods comparable. The hotel bar SOP provides related operating guidance.
Record Receiving, Returns, and Transfers
Receiving records establish what stock entered your operation and at what cost. Compare the delivery with its invoice and order, noting substitutions, damage, shortages, and bottle-size differences before accepting the record as complete.
Capture product, date, quantity, unit, location, supplier, and invoice reference. Record supplier returns and credits separately so an adjustment is not deducted twice. Distinguish delivery dates from accounting entry dates when reconciling period boundaries.
Transfer records need sending and receiving locations, quantity, product, date, and confirmation. A case moved from storage to a service bar is not a sale. If only one side records that movement, both outlet reports can become misleading.
Standardize Units and Partial-Bottle Measurements
Standardized units make inventory quantities comparable across receiving, recipes, and counts. Keep bottle sizes distinct and convert cases or other purchase units into the units your calculations use.
For open bottles, document the measurement method and apply it consistently. A bottle-equivalent value must refer to its stated capacity; half of a 750 mL bottle is different from half of a 1 L bottle.
Train counters with the same products and counting sequence. Review unexplained changes in partial-bottle values before treating them as depletion. Your inventory method should produce repeatable observations rather than depend on each person's interpretation.
Align Count Boundaries With Sales Periods
Count boundaries define when the opening stock period ends and the next one begins. Match sales, receipts, transfers, and adjustments to those same boundaries.
A count taken before opening can provide a clear closing boundary for the prior operating period. If service continues during a count, document intervening sales and stock movements or use a procedure that accounts for them.
Record the count time, areas covered, and reviewer. Retain the original snapshot before correcting an error so you can understand what changed. A revised count should improve the record, not erase the evidence of the original discrepancy.
Reconcile Stock With Sales and Recorded Usage
Reconciliation compares inventory-derived usage with recipe expectations and documented non-sale use. It requires more than comparing purchase invoices directly with sales revenue.
Calculate quantity used from opening stock plus receipts and transfers in, minus transfers out, supplier returns, and closing stock. Convert quantities to a consistent cost basis when preparing financial comparisons.
Then reconcile recorded sales, approved complimentary servings, waste, and other documented use. Product-level usage reports help organize this review. Keep unresolved discrepancies separate from legitimate use rather than assigning a cause before the records support one.
Calculate Liquor Cost and Gross Margin
Liquor cost percentage measures consumption cost as a share of matching net liquor sales. Use inventory values at cost and exclude sales taxes and tips consistently with your accounting policy.
Usage cost = Opening inventory + Purchases + Transfers in − Transfers out − Supplier returns − Closing inventory.
Liquor cost percentage = Usage cost ÷ Matching net liquor sales × 100. If purchases are already net of returns or credits, do not deduct those adjustments again. If sales are zero, the percentage is undefined.
Use a Worked Liquor Cost Example
This hypothetical weekly example begins with $8,000 in stock. Purchases are $4,500, transfers in are $300, transfers out are $200, supplier returns are $150, and closing inventory is $7,800.
Usage cost is $8,000 + $4,500 + $300 − $200 − $150 − $7,800 = $4,650. With matching net sales of $22,000, liquor cost is $4,650 ÷ $22,000 × 100 = 21.14%.
These figures illustrate the method, not a recommended target. The companion article How to Calculate Liquor Cost in 5 Simple Steps (2026) develops the calculation into a detailed workflow.
Keep Gross Margin Separate From Net Profit
Gross margin describes the sales remaining after product cost, before other operating expenses. For the hypothetical example, gross profit is $22,000 minus $4,650, or $17,350; gross margin is approximately 78.86%.
Net profit also reflects labor, occupancy, utilities, and other expenses. A beverage category can produce a favorable gross margin while the business remains unprofitable. Evaluate the cost ratio alongside sales volume and operating costs.
Cheryl Stanley, Senior Lecturer at Cornell's Nolan School of Hotel Administration, addresses pricing and controls in her beverage program course. Those management decisions belong in the same financial review.
Maintain a Consistent Inventory Valuation Policy
A consistent valuation policy makes opening stock, receipts, closing stock, and recipe costs comparable. Agree the policy with your accountant and document how changing supplier costs are handled.
Do not silently replace every historical cost with the latest invoice price. A valuation change can alter reported usage without changing the physical quantity consumed. Separate genuine supplier-cost changes from quantity discrepancies during your review.
Keep a record of adjustments and their reasons. If you change a valuation method, explain the effect before comparing the new ratio with prior periods. An apparent improvement may otherwise reflect accounting treatment rather than operational progress.
Set a Liquor Cost Target for Your Bar
A useful liquor cost target comes from your recipe quantities, ingredient costs, net selling prices, and revenue mix. There is no universal percentage that proves every bar is operating well.
Cost each recipe using the quantities you intend to serve. Divide ingredient cost by its matching selling price to calculate the expected ratio. Maintain the same ingredient scope in actual and theoretical calculations.
For a hypothetical drink with $2.80 of ingredients and a $14 net price, theoretical cost is 20%. This is an illustrative recipe result, not a benchmark for an entire beverage program.
Weight Category Targets by Revenue Share
A revenue-weighted target multiplies each category's theoretical cost ratio by its share of sales revenue and adds the results. Weighting by drink counts instead can distort the blend when prices differ.
In a hypothetical program, spirits produce 50% of revenue at an 18% target, beer produces 25% at 24%, and wine produces 25% at 32%. The blended target is 0.50 × 18% + 0.25 × 24% + 0.25 × 32% = 23%.
These category ratios are examples, not recommendations. The companion article What Is a Good Liquor Cost Percentage for Your Bar? explains how to interpret your own target and actual results.
Review Pricing, Costs, and Sales Mix Together
Changes in purchasing costs, selling prices, and sales mix can alter your cost percentage without indicating unauthorized usage. Recalculate your baseline when those inputs change materially.
A shift toward a higher-cost category raises the blended target even when every recipe is followed. Review category results before changing portions or attributing the increase to staff performance.
Separate price effects from quantity effects whenever possible. Maintain guest-quality standards while reviewing the financial result. A lower percentage achieved through under-portions does not establish a healthier operation or a more dependable guest experience.
Organize a Bar Inventory Spreadsheet
A bar inventory spreadsheet should connect product identity, quantities, units, locations, and costs. Use dated count snapshots and separate movement logs so closing stock does not have to explain every transaction by itself.
Core fields include SKU, product name, category, bottle size, counting unit, location, opening quantity, closing quantity, and unit cost. Receiving and transfer records provide the changes between those snapshots.
Keep wine inventory distinct where serving formats and storage locations differ. The companion article Bar Inventory Spreadsheet: Fields, Formulas, and Examples provides a worked worksheet.
Protect Formulas and Retain Movement Records
Protected formulas and retained movement records reduce accidental changes that can distort your worksheet. Limit edits to approved input cells and use consistent product and location names.
Maintain receiving, returns, transfers, and documented waste separately. A waste record explains consumption without a sale, but it should not be removed from actual physical usage when calculating total consumption cost.
Archive each period before starting the next. If an error is corrected, retain the reason and reviewer. This record makes repeated issues visible and helps you distinguish a spreadsheet error from a purchasing or portion-standard problem.
Avoid Mixed Units and Percentage-Formatting Errors
Mixed units and incorrect percentage formatting can create false cost results even when the physical count is accurate. Validate the unit attached to each quantity before using it in a formula.
Convert a case receipt to bottles when bottles are your counting unit. Track different capacities separately. For beer and dry goods, define keg, package, and ingredient units explicitly.
In a spreadsheet, a ratio of 0.2314 becomes 23.14% when percentage formatting is applied. Do not multiply by 100 and then apply percentage formatting again, or the displayed result will be inflated.
Compare Actual and Theoretical Beverage Cost
Actual beverage cost measures inventory consumed; theoretical beverage cost estimates recipe-based consumption for recorded sales. Their difference identifies a discrepancy that needs reconciliation, not a proven cause of loss.
Theoretical cost = Sum of recorded item sales × Standard recipe cost per item. Match dates, locations, ingredient scope, and cost basis before comparing it with inventory-derived actual cost.
Dollar variance = Actual cost − Theoretical cost. Document whether your theoretical measure covers sales alone or also includes approved non-sale usage. Changing that definition changes what remains unexplained.
Interpret Dollar Gaps and Percentage-Point Differences
Dollar variance states the cost difference; a percentage-point gap compares the two ratios using matching sales revenue. Do not describe a percentage-point change as a relative percentage increase.
In a hypothetical period with $20,000 in sales, theoretical cost of $4,000 is 20%. Actual cost of $4,700 is 23.5%. The gap is $700, or 3.5 percentage points.
Reconcile documented non-sale use and record errors before interpreting the remaining difference. The companion article Actual vs. Theoretical Beverage Cost: Explain the Gap develops this comparison into an investigation process.
Review Negative Variance and Category Offsets
Negative variance means actual cost is below the theoretical expectation, but it still needs review. Possible explanations include under-portions, overstated recipes, omitted purchases, or count errors.
Do not reward a low blended result without checking its components. Positive variance in one product can be offset by negative variance elsewhere, concealing both issues in a property-wide total.
Compare quantities as well as values when supplier costs change. A consistent variance review should distinguish pricing, measurement, mapping, and operational causes rather than treat every difference as missing product.
Improve Purchasing and Stock Availability
Purchasing decisions should use current counts, recent usage, delivery lead times, and expected service demand. Stock availability and cash tied up in inventory both belong in the decision.
Ordering too little can cause substitutions and missed sales. Ordering too much ties up cash and may expose perishable or opened products to waste. Evaluate an extra case against likely use rather than a discount alone.
Consider approved events, reservations, seasonal demand, and supplier delivery schedules. Historical usage informs the order, but it should not be treated as a complete forecast when operating conditions have changed.
Distinguish Par Levels From Reorder Points
A par level is the target quantity you order up to; a reorder point is the stock level that triggers an order. Define both consistently in your operation.
A basic reorder point equals expected demand during lead time plus a safety buffer. In a hypothetical example, usage of two bottles daily, three days of lead time, and four safety-stock bottles produce a ten-bottle reorder point.
For ordering, consider usable stock, confirmed stock already on order, and scheduled requirements. Review the buffer when deliveries or demand become less predictable instead of increasing every product's par indiscriminately.
Investigate Discrepancies Before Assigning Blame
Investigate the records and operating process before attributing a discrepancy to intentional loss. A variance report narrows what needs examination; it does not establish individual responsibility.
Check physical coverage, receiving, transfers, POS mapping, recipes, and documented non-sale use in a consistent sequence. Retain the evidence and correction applied so the next review can confirm whether the issue recurs.
A repeatable beverage audit gives staff a clear process. Share verified findings and expectations, rather than starting a discussion with an accusation based on an aggregate ratio.
Check Counts, Receiving, and Transfers First
Count and movement checks establish whether your actual-usage inputs are reliable. Recount affected items where practical, verify all storage areas, and compare receipts with supplier records.
Check for duplicate invoices, unrecorded credits, unit errors, and deliveries entered in the wrong period. A missing receipt can understate consumption; a duplicate can overstate it. Different errors do not all move variance in the same direction.
Confirm both sides of a transfer and its reporting scope. At outlet level, undocumented movement can appear as a shortage in one location and surplus in another without changing total property stock.
Check Recipes, POS Mapping, and Non-Sale Use
Recipe and sales-mapping checks establish whether your theoretical expectation matches the drinks recorded. Review substitutions, recipe changes, item buttons, and serving quantities for affected products.
Reconcile approved complimentary servings, breakage, spills, returned drinks, and tastings. These explain non-sale consumption when recorded accurately. Keep them in total actual usage, then account for them when calculating the residual unexplained gap.
Review persistent patterns only after correcting the inputs. Escalate concerns through your documented management procedures and applicable policies. An item-level discrepancy is evidence to examine, not permission to assume who caused it.
How Scannabar Supports Inventory and Cost Control
Scannabar supports inventory measurement, stock tracking, and usage reporting for hospitality operations. Those capabilities help connect the physical count with the records used in a cost review.
Scannabar's liquor inventory system provides barcode-enabled measurement and reporting by product and outlet. Its POS reconciliation supports comparison of observed usage with recorded sales.
Use the reports alongside documented receiving, transfers, and recipes. A system can organize inputs and identify discrepancies, but interpreting a gap still requires operational records and a fair investigation.
Build Accountability Around Evidence
Evidence-based accountability makes responsibilities and records visible without treating inventory control as a presumption of misconduct. Define who receives, counts, reviews, and approves adjustments.
Scannabar's inventory controls support product and location visibility. Use that visibility to focus training and reviews on the process that needs improvement.
Let staff explain legitimate stock movements and document the outcome. Close each review with a specific action, owner, and follow-up date. The next period should show whether the correction improved the record or whether further investigation is needed.
Build a Repeatable Cost-Control Routine
A repeatable routine brings count preparation, physical observations, reconciliation, and purchasing review into one scheduled process. Choose a cadence that fits your service volume, risk, and available staff.
More frequent reviews shorten the period you need to investigate, but accuracy matters as much as frequency. A rushed count with unmatched boundaries can create more confusion than a carefully documented one.
Start with a clear operating standard and improve it as recurring exceptions become visible. Each review should leave a retained snapshot, explained adjustments, and named actions rather than only a new percentage.
Use a Count-Period Checklist
A count-period checklist makes the review sequence visible and assigns the evidence needed at each stage. Adapt this sequence to your locations and accounting policy.
- Before counting: Confirm receiving, transfers, returns, and sales boundaries; prepare the product and location list.
- During counting: Cover every location, use consistent units, record partial quantities, and document exceptions.
- After counting: Calculate usage, reconcile sales and non-sale use, and flag unexplained item-level differences.
- During management review: Check costs and revenue mix, agree corrective actions, and update purchasing requirements.
- Before the next cycle: Confirm actions were completed and retain prior records for comparison.
A checklist should reflect your actual operating procedure. Review omissions and recurring corrections so the process improves rather than reproduces the same exceptions each period.
Build a Connected Inventory and Cost-Control System
Connected inventory control turns counts and movement records into decisions you can explain. Start with a defined scope, reliable units, and matched reporting boundaries.
Then calculate consumption cost, establish recipe-based targets, and investigate variance with evidence. Use the companion articles for deeper calculations and spreadsheet design as each resource becomes available.
Your next step is a documented routine with clear ownership. Consistent reviews support better purchasing and fairer operational decisions while keeping gross margin, net profit, and unexplained usage distinct.
FAQs About Liquor Inventory and Cost Control
Does a high liquor cost percentage prove theft?
No. High cost can reflect pricing, sales mix, supplier changes, record errors, waste, or unauthorized usage. Scannabar's product-level reports help narrow the review, but evidence from counts, movements, recipes, and approved non-sale use is necessary before attributing a discrepancy to anyone.
How often should you count liquor inventory?
Choose a count frequency that fits your volume, risk, and ability to maintain reliable records. Scannabar's counting workflow supports regular reviews. Shorter periods can narrow investigations, but matched boundaries and consistent measurements remain necessary at any cadence.
Can inventory software replace physical observations?
No. Reliable inventory needs trustworthy observations and documented stock movements. Scannabar supports barcode-enabled measurement and usage reporting, but incomplete receiving or transfer records can still distort the result. Use software with a defined operating routine and retained review evidence.
Is there one correct liquor cost target?
No. Your target depends on recipes, ingredient costs, prices, and revenue mix. A recipe-based target provides a defensible starting point. Compare actual consumption with that expectation and investigate changes before assuming a published average is appropriate for your operation.
Should waste be excluded from actual usage cost?
No. Waste consumes product and remains part of inventory-derived usage cost. Document it separately so you can explain the gap between physical consumption and sales-based theoretical usage. Deduct documented non-sale use when analyzing residual unexplained variance, not when measuring total consumption.
 Industry studies have consistently shown that a full 25% to 30% of a bar's liquor inventory never converts into registered sales. That is the equivalent of about six to eight 1.25 oz portions per bottle (which should yield at least 25 portions.) This loss of liquor volume--due to unauthorized comps, over-pouring, spillage or theft--should be of great concern to any bar manager.
  A typical beverage operation generates a constant stream of data and information, endless columns of figures and daily records. But you'd be surprised how few managers actually do anything with these figures, let alone fully grasp their implications. So how can you tell if you're operating profitably? The answer is you can't, unless, of course, you get to grips with some basic mathematics. For a start, you'll need to know how to perform a few simple calculations, such as working out an item's cost percentage. You don't need to be a mathematician to figure the following straightforward formulas:
 Accounting (bookkeeping) theft is a major concern within the beverage industry. From falsifying daily inventory records to complicated auditing abuse, this area of theft is often the most difficult to detect. Sometimes, it is the managers themselves who are behind the scams. Owners need to be aware of the following possibilities:

 By Chris Parry
 By Chris Parry