Illustrative AI-generated image of consistent drink preparation.
A good liquor cost percentage is a target your own recipes, purchase costs, and selling prices can support. There is no single percentage that establishes whether every bar is operating well. A spirits-focused venue and a wine-led restaurant can have different cost ratios and both produce healthy gross profit.
Your liquor inventory control should connect that target with measured consumption. Scannabar helps you review the stock and usage data behind the result, rather than treating a published average as a diagnosis.
Liquor cost percentage compares product consumed with matching sales revenue; purchases alone do not establish what your bar used.
Your recipe costs, selling prices, and revenue mix determine a realistic theoretical target for your own beverage program.
Weight category cost ratios by revenue share, not by the number of drinks sold, to calculate a blended target.
Scannabar supports inventory counts and usage reporting so you can compare expected consumption with the stock your operation used.
Investigate changes in pricing, portions, records, and documented waste before interpreting a higher ratio as unexplained loss or theft.
What Does Liquor Cost Percentage Measure?
Liquor cost percentage measures consumption cost as a share of liquor sales for a defined period. Divide cost used by matching net sales and multiply by 100.
Calculate usage from opening stock plus net purchases and transfers in, minus transfers out and closing stock. Keep all stock values at cost and use a consistent valuation policy. Usage reports organize the inputs, but the reporting scope still needs to match.
An illustrative 22% ratio leaves 78% of sales before labor, rent, and other expenses. That remainder is gross margin, not net profit.
Why Do Liquor Cost Targets Vary by Bar?
Targets vary because ingredient costs, menu prices, and revenue mix vary. A lower cost percentage is not automatically a better business if it comes with lower sales or weaker guest retention.
Separate wine from spirits and beer before reviewing a blended result. Different serving formats and purchasing costs can move the blend even when staff follow every recipe.
Cheryl Stanley, Senior Lecturer at Cornell's Nolan School of Hotel Administration, addresses product selection, pricing, and controls in her beverage management course. Evaluate those decisions together when setting your target.
Set a Target Using Your Own Drink Recipes
Start with current recipe costs divided by net selling prices. A hypothetical drink using $2.80 of ingredients and selling for $14 has a theoretical cost percentage of 20%.
Use actual ingredient quantities, documented bottle sizes, and consistent units. Update costs when supplier prices change. Standard recipes and portion control keep your theoretical baseline connected to the drink served.
Include the same ingredients in actual and theoretical cost. A spirits-only calculation cannot be compared directly with a recipe calculation that also includes mixers and garnishes.
Weight the Target by Revenue Share
A blended target is the sum of each category's cost percentage multiplied by its share of beverage revenue. Weighting by drink counts instead can distort the answer when selling prices differ.
Illustrative revenue-weighted target, not industry benchmarks
Category
Revenue share
Theoretical cost
Contribution
Spirits
50%
18%
9 percentage points
Beer
25%
24%
6 percentage points
Wine
25%
32%
8 percentage points
Total
100%
23% blended target
23 percentage points
The hypothetical target is 23%. These category figures are examples, not recommended ranges. Track beer stock separately so changes in its revenue share do not hide a spirits discrepancy.
Compare Your Target With Actual Liquor Cost
Compare expected cost with inventory-derived usage over the same dates, categories, and locations. The dollar gap is actual cost minus theoretical cost; the ratio gap is expressed in percentage points.
If hypothetical sales are $20,000, a 23% target implies $4,600 in expected cost. Actual cost of $5,200 produces a 26% ratio and a $600 gap, or three percentage points. Review variance by item to identify what needs reconciliation.
Do not label the entire gap theft. Recorded waste, complimentary drinks, changing costs, count errors, and recipe mapping may explain part or all of it.
Separate Price Changes From Unexplained Usage
Price changes alter recipe cost even if portions stay constant. Unexplained usage is depletion that remains after you reconcile sales, documented non-sale use, and stock movements.
Review invoices first, then count quality and POS recipe mapping. A consistent inventory method helps prevent measurement differences from appearing as operational loss.
Increase review frequency when discrepancies persist. Beverage audits provide a structure for checking the records rather than relying on a single blended percentage.
How Scannabar Supports Margin Reviews
Scannabar's liquor inventory system records bottle-level stock and reconciles usage against POS sales. Product and outlet reporting help you investigate the underlying items rather than only the property-wide average.
Use inventory accountability to protect staff from unsupported accusations. Share the calculation and evidence with your team, then address receiving, recipes, or waste processes according to the findings.
Conclusion: Set a Target Your Bar Can Explain
Your most useful target comes from costed recipes and revenue mix. Recalculate it when those inputs change, and compare it with actual usage consistently. A percentage becomes actionable when you understand the dollars and operating records behind it.
FAQs About Liquor Cost Targets
Can a higher liquor cost percentage still be profitable?
Yes. Profitability depends on gross profit dollars and all operating expenses, not just one cost ratio. Scannabar's usage reporting helps you examine product costs, but labor, occupancy, sales volume, and guest demand also belong in a full profitability review.
How often should you review the target?
Review it when supplier costs, recipes, menu prices, or revenue mix change materially. Scannabar's stock and usage reports support the actual-cost side of that review. Keep the theoretical baseline current so yesterday's costs do not create misleading variance today.
Does a low liquor cost prove inventory is controlled?
No. A low aggregate ratio can hide offsetting errors, under-portions, or category-level discrepancies. Scannabar's product-level reporting helps you inspect those patterns. Pair the financial review with recipe checks and guest-quality standards rather than rewarding the lowest number alone.
Illustrative AI-generated image of a liquor inventory review.
Liquor cost percentage equals the cost of liquor consumed divided by liquor sales for the same period, multiplied by 100. Your purchases alone do not tell you what you consumed. Stock remaining on the shelf belongs in the calculation.
For an illustrative bar with $600,000 in annual liquor sales, a four-percentage-point gap between actual cost and its own target represents $24,000 in additional product cost. That gap deserves investigation, not an automatic accusation of theft.
Scannabar supports liquor inventory control with bottle-level counting and usage reporting. The five steps below explain the calculation behind those numbers.
1. Match Reporting Dates and Categories: Align inventory boundaries with sales dates and your beverage categories.
2. Value Beginning Inventory: Record full and partial bottles using a consistent cost basis.
3. Record Purchases, Returns, and Transfers: Reconcile deliveries and movements within the reporting period you selected.
4. Calculate Usage Cost: Deduct ending stock after adjusting opening inventory for recorded movements.
5. Divide Usage Cost by Liquor Sales: Convert consumption cost into a percentage of matching sales revenue.
Calculate Your Bar's Liquor Cost Percentage
1. Match Reporting Dates and Categories
Choose a period with inventory counts at its opening and closing boundaries. Pull POS sales for those same dates and locations. A count taken after additional service cannot reliably close an earlier sales period unless you account for intervening activity.
Separate spirits from wine and beer when you need category-level answers. Compare the same ingredient scope on both sides: spirits-only costs should not be divided by all restaurant revenue. Consistent scope makes beverage variance easier to interpret.
2. Value Beginning Inventory
Beginning inventory is the cost value of stock on hand at the start of the period. Include the back bar, service stations, storage, and any other locations inside your reporting scope.
Record bottle size, quantity, and partial contents consistently. Use a documented valuation policy agreed with your accountant rather than switching cost methods between counts. Review your counting method when partial-bottle measurements vary between staff.
3. Record Purchases, Returns, and Transfers
Include liquor received during the period, reconcile invoices to deliveries, and deduct documented supplier returns or credits once. An invoice entered twice inflates consumption even if every bottle was poured correctly.
For outlet reporting, add transfers in and deduct transfers out at cost. Transfers within a whole-property scope cancel out; do not treat them as new purchases. Keep wine stock and other categories separate if your calculation covers liquor only.
4. Calculate Usage Cost
Usage cost equals beginning inventory plus net purchases plus transfers in, minus transfers out and ending inventory. All inputs are dollar values at cost, not selling prices.
Usage cost = Beginning inventory + Net purchases + Transfers in − Transfers out − Ending inventory.
Count ending inventory using the same scope and valuation policy. Usage includes sold product, documented waste, complimentary drinks, and unexplained depletion. It is a measure of consumption, not proof of its cause. Inventory reports help organize the review.
5. Divide Usage Cost by Liquor Sales
Divide usage cost by net liquor sales for the matching period and multiply by 100. Exclude tips and taxes from sales consistently with your accounting policy. If sales are zero, the percentage is undefined.
Compare your result with your recipe-based target and prior periods. Supplier costs, discounts, sales mix, measurement errors, and over-pouring can all change the result.
Worked Example: A Weekly Liquor Cost Calculation
This hypothetical example assumes no transfers. Opening stock is $8,400, deliveries total $5,200, returns are $180, and ending stock is $9,060. Usage cost is $8,400 + $5,200 − $180 − $9,060 = $4,360.
Illustrative liquor cost calculation
Measure
Result
Usage cost
$4,360
Net liquor sales
$18,200
Liquor cost percentage
23.96%
Gross profit before other expenses
$13,840
If the recipe-based target were 20%, expected cost would be $3,640. The $720 difference needs reconciliation against records, prices, waste, and portions. It is not automatically recoverable profit.
Why Can Purchases Differ From Liquor Consumed?
Purchases increase stock; consumption reduces it. A large delivery near period-end can increase purchases without increasing usage by the same amount. Ending inventory removes the unconsumed stock from the calculation.
Keep beer and dry goods in their appropriate categories so receiving activity does not distort a spirits-only calculation.
How Does Liquor Cost Affect Gross Profit?
Lower product cost increases gross profit at unchanged sales, but net profit also depends on labor, occupancy, and other operating expenses. A strong liquor margin does not establish that the entire business is profitable.
Cheryl Stanley, Senior Lecturer at Cornell's Nolan School of Hotel Administration, covers pricing and controls in her beverage program course. Those decisions should be assessed together, rather than treating one cost ratio as the whole business.
How Scannabar Supports Liquor Cost Control
Scannabar provides liquor inventory software with bottle-level measurement, usage reports, and POS reconciliation. Consistent inventory inputs support both the cost calculation and the investigation that follows it.
Use Scannabar's inventory controls to build a culture of accountability that protects staff from false accusations. Review the reporting workflow with your team before making operational changes.
FAQs About Liquor Cost Calculations
Is liquor cost the same as pour cost?
The terms often describe the same period cost ratio. A per-drink recipe cost is different: it describes expected ingredient cost for one serving. Scannabar's usage reports support the inventory-based view, which includes depletion that recipes and recorded sales alone do not explain.
How often should you calculate liquor cost?
A weekly review is a practical starting point for an active bar, provided counts and sales share the same boundaries. Scannabar's counting workflow supports frequent reviews. Choose a cadence your team can execute consistently and add spot checks for high-value stock when appropriate.
Does a high liquor cost prove theft?
No. High cost can reflect pricing, sales mix, supplier changes, recording errors, waste, or unauthorized usage. Scannabar's product-level reports help narrow the review, but records and operational evidence are still necessary before attributing a discrepancy to an individual.
Illustrative AI-generated image of a bar inventory review.
Liquor inventory control connects stock counts, receiving records, transfers, recipes, and sales so you can understand what your beverage operation consumed and what that consumption cost. Cost control uses those records to guide pricing, purchasing, portion standards, and corrective action.
Scannabar supports liquor inventory control with barcode-enabled inventory measurement and usage reporting. This guide explains the operating process behind the reports, including how to calculate costs and investigate discrepancies without turning a number into an unsupported accusation.
Use the sections as a reference for your bar, restaurant, or hotel. The four companion articles provide deeper calculations and worksheet examples; this guide shows how their subjects fit together into a repeatable management routine.
Key Takeaways: Liquor Inventory and Cost Control
Reliable liquor inventory starts with documented receiving, stock movements, and consistent counts across every location included in your reporting scope.
Calculate liquor cost from inventory consumed and matching sales, using the same dates, categories, and valuation policy for both inputs.
Set cost targets from your recipes and revenue mix instead of treating an industry average as a diagnosis for your bar.
Scannabar supports barcode-enabled inventory measurement and product-level reporting that help you review the evidence behind stock and usage discrepancies.
Reconcile count errors, purchasing records, transfers, waste, and recipe mapping before drawing conclusions about the cause of unexplained beverage variance.
What Is Liquor Inventory Control?
Liquor inventory control accounts for stock entering, moving through, and leaving your operation. It connects a physical count with the records that explain what changed between counts.
Buying and selling records alone cannot establish consumption. Some purchases remain on the shelf, some stock moves to another outlet, and some product is consumed without an ordinary sale. Opening and closing counts establish the boundaries for reviewing those movements.
Your objective is a traceable record of stock and usage. That record supports purchasing decisions, financial reviews, and operational investigations. It also protects staff from being blamed for discrepancies that originate in incomplete records or inconsistent measurements.
Define the Inventory Scope Before Counting
Inventory scope specifies the locations, categories, and dates covered by your review. Document those boundaries before your first count so receiving and sales records can be matched to the same operation.
A hotel-wide report may include a central storeroom, restaurant, lobby bar, and banquet operation. An outlet report includes only its assigned stock. Transfers between included locations cancel at property level but must be recorded for each outlet.
Define spirits, wine, beer, and other ingredients consistently. A spirits-only cost calculation should not use all restaurant sales as its denominator. Mixing categories can make a ratio look favorable while concealing the economics of the category you intended to review.
Build a Reliable Liquor Inventory Process
A reliable liquor inventory process records stock movements, measures opening and closing quantities, and reconciles usage against matching sales. Assign ownership for each step and document how exceptions are handled.
Your process should remain consistent when staff change. A written routine, named reporting locations, standardized units, and retained count records make periods comparable. The hotel bar SOP provides related operating guidance.
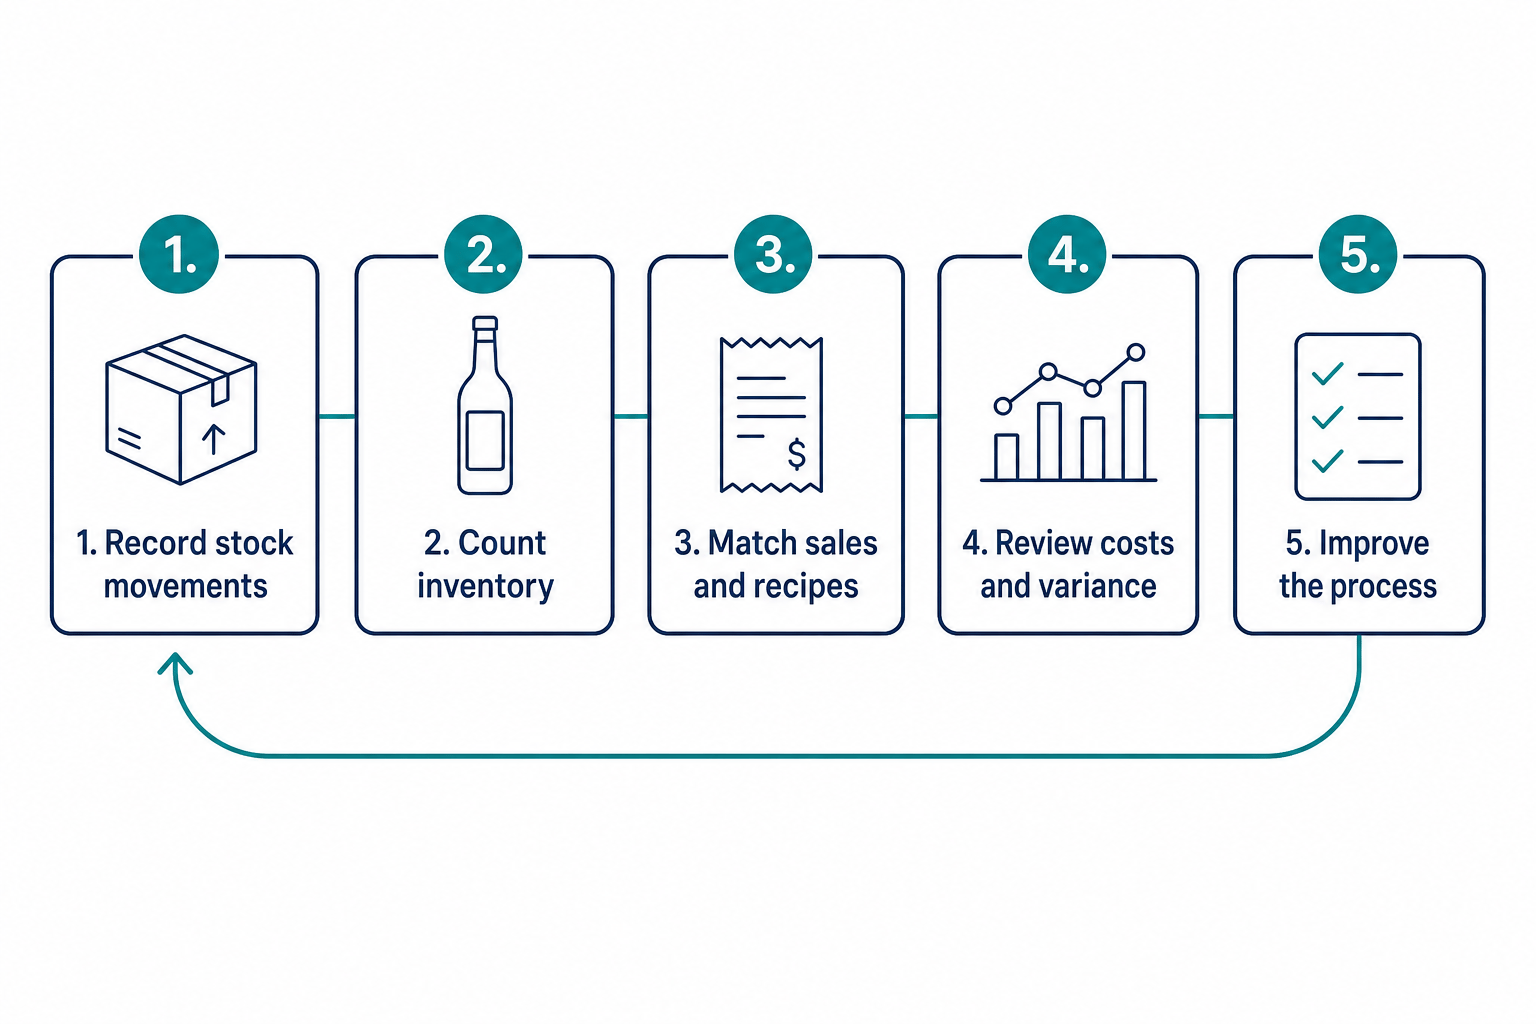
Record movements → Count inventory → Match sales and recipes → Review costs and variance → Improve the process. Repeat using consistent reporting periods.
Record Receiving, Returns, and Transfers
Receiving records establish what stock entered your operation and at what cost. Compare the delivery with its invoice and order, noting substitutions, damage, shortages, and bottle-size differences before accepting the record as complete.
Capture product, date, quantity, unit, location, supplier, and invoice reference. Record supplier returns and credits separately so an adjustment is not deducted twice. Distinguish delivery dates from accounting entry dates when reconciling period boundaries.
Transfer records need sending and receiving locations, quantity, product, date, and confirmation. A case moved from storage to a service bar is not a sale. If only one side records that movement, both outlet reports can become misleading.
Standardize Units and Partial-Bottle Measurements
Standardized units make inventory quantities comparable across receiving, recipes, and counts. Keep bottle sizes distinct and convert cases or other purchase units into the units your calculations use.
For open bottles, document the measurement method and apply it consistently. A bottle-equivalent value must refer to its stated capacity; half of a 750 mL bottle is different from half of a 1 L bottle.
Train counters with the same products and counting sequence. Review unexplained changes in partial-bottle values before treating them as depletion. Your inventory method should produce repeatable observations rather than depend on each person's interpretation.
Align Count Boundaries With Sales Periods
Count boundaries define when the opening stock period ends and the next one begins. Match sales, receipts, transfers, and adjustments to those same boundaries.
A count taken before opening can provide a clear closing boundary for the prior operating period. If service continues during a count, document intervening sales and stock movements or use a procedure that accounts for them.
Record the count time, areas covered, and reviewer. Retain the original snapshot before correcting an error so you can understand what changed. A revised count should improve the record, not erase the evidence of the original discrepancy.
Reconcile Stock With Sales and Recorded Usage
Reconciliation compares inventory-derived usage with recipe expectations and documented non-sale use. It requires more than comparing purchase invoices directly with sales revenue.
Calculate quantity used from opening stock plus receipts and transfers in, minus transfers out, supplier returns, and closing stock. Convert quantities to a consistent cost basis when preparing financial comparisons.
Then reconcile recorded sales, approved complimentary servings, waste, and other documented use. Product-level usage reports help organize this review. Keep unresolved discrepancies separate from legitimate use rather than assigning a cause before the records support one.
Calculate Liquor Cost and Gross Margin
Liquor cost percentage measures consumption cost as a share of matching net liquor sales. Use inventory values at cost and exclude sales taxes and tips consistently with your accounting policy.
Usage cost = Opening inventory + Purchases + Transfers in − Transfers out − Supplier returns − Closing inventory.
Liquor cost percentage = Usage cost ÷ Matching net liquor sales × 100. If purchases are already net of returns or credits, do not deduct those adjustments again. If sales are zero, the percentage is undefined.
Use a Worked Liquor Cost Example
This hypothetical weekly example begins with $8,000 in stock. Purchases are $4,500, transfers in are $300, transfers out are $200, supplier returns are $150, and closing inventory is $7,800.
Usage cost is $8,000 + $4,500 + $300 − $200 − $150 − $7,800 = $4,650. With matching net sales of $22,000, liquor cost is $4,650 ÷ $22,000 × 100 = 21.14%.
These figures illustrate the method, not a recommended target. The companion article How to Calculate Liquor Cost in 5 Simple Steps (2026) develops the calculation into a detailed workflow.
Keep Gross Margin Separate From Net Profit
Gross margin describes the sales remaining after product cost, before other operating expenses. For the hypothetical example, gross profit is $22,000 minus $4,650, or $17,350; gross margin is approximately 78.86%.
Net profit also reflects labor, occupancy, utilities, and other expenses. A beverage category can produce a favorable gross margin while the business remains unprofitable. Evaluate the cost ratio alongside sales volume and operating costs.
Cheryl Stanley, Senior Lecturer at Cornell's Nolan School of Hotel Administration, addresses pricing and controls in her beverage program course. Those management decisions belong in the same financial review.
Maintain a Consistent Inventory Valuation Policy
A consistent valuation policy makes opening stock, receipts, closing stock, and recipe costs comparable. Agree the policy with your accountant and document how changing supplier costs are handled.
Do not silently replace every historical cost with the latest invoice price. A valuation change can alter reported usage without changing the physical quantity consumed. Separate genuine supplier-cost changes from quantity discrepancies during your review.
Keep a record of adjustments and their reasons. If you change a valuation method, explain the effect before comparing the new ratio with prior periods. An apparent improvement may otherwise reflect accounting treatment rather than operational progress.
Set a Liquor Cost Target for Your Bar
A useful liquor cost target comes from your recipe quantities, ingredient costs, net selling prices, and revenue mix. There is no universal percentage that proves every bar is operating well.
Cost each recipe using the quantities you intend to serve. Divide ingredient cost by its matching selling price to calculate the expected ratio. Maintain the same ingredient scope in actual and theoretical calculations.
For a hypothetical drink with $2.80 of ingredients and a $14 net price, theoretical cost is 20%. This is an illustrative recipe result, not a benchmark for an entire beverage program.
Weight Category Targets by Revenue Share
A revenue-weighted target multiplies each category's theoretical cost ratio by its share of sales revenue and adds the results. Weighting by drink counts instead can distort the blend when prices differ.
In a hypothetical program, spirits produce 50% of revenue at an 18% target, beer produces 25% at 24%, and wine produces 25% at 32%. The blended target is 0.50 × 18% + 0.25 × 24% + 0.25 × 32% = 23%.
These category ratios are examples, not recommendations. The companion article What Is a Good Liquor Cost Percentage for Your Bar? explains how to interpret your own target and actual results.
Review Pricing, Costs, and Sales Mix Together
Changes in purchasing costs, selling prices, and sales mix can alter your cost percentage without indicating unauthorized usage. Recalculate your baseline when those inputs change materially.
A shift toward a higher-cost category raises the blended target even when every recipe is followed. Review category results before changing portions or attributing the increase to staff performance.
Separate price effects from quantity effects whenever possible. Maintain guest-quality standards while reviewing the financial result. A lower percentage achieved through under-portions does not establish a healthier operation or a more dependable guest experience.
Organize a Bar Inventory Spreadsheet
A bar inventory spreadsheet should connect product identity, quantities, units, locations, and costs. Use dated count snapshots and separate movement logs so closing stock does not have to explain every transaction by itself.
Core fields include SKU, product name, category, bottle size, counting unit, location, opening quantity, closing quantity, and unit cost. Receiving and transfer records provide the changes between those snapshots.
Keep wine inventory distinct where serving formats and storage locations differ. The companion article Bar Inventory Spreadsheet: Fields, Formulas, and Examples provides a worked worksheet.
Protect Formulas and Retain Movement Records
Protected formulas and retained movement records reduce accidental changes that can distort your worksheet. Limit edits to approved input cells and use consistent product and location names.
Maintain receiving, returns, transfers, and documented waste separately. A waste record explains consumption without a sale, but it should not be removed from actual physical usage when calculating total consumption cost.
Archive each period before starting the next. If an error is corrected, retain the reason and reviewer. This record makes repeated issues visible and helps you distinguish a spreadsheet error from a purchasing or portion-standard problem.
Avoid Mixed Units and Percentage-Formatting Errors
Mixed units and incorrect percentage formatting can create false cost results even when the physical count is accurate. Validate the unit attached to each quantity before using it in a formula.
Convert a case receipt to bottles when bottles are your counting unit. Track different capacities separately. For beer and dry goods, define keg, package, and ingredient units explicitly.
In a spreadsheet, a ratio of 0.2314 becomes 23.14% when percentage formatting is applied. Do not multiply by 100 and then apply percentage formatting again, or the displayed result will be inflated.
Compare Actual and Theoretical Beverage Cost
Actual beverage cost measures inventory consumed; theoretical beverage cost estimates recipe-based consumption for recorded sales. Their difference identifies a discrepancy that needs reconciliation, not a proven cause of loss.
Theoretical cost = Sum of recorded item sales × Standard recipe cost per item. Match dates, locations, ingredient scope, and cost basis before comparing it with inventory-derived actual cost.
Dollar variance = Actual cost − Theoretical cost. Document whether your theoretical measure covers sales alone or also includes approved non-sale usage. Changing that definition changes what remains unexplained.
Interpret Dollar Gaps and Percentage-Point Differences
Dollar variance states the cost difference; a percentage-point gap compares the two ratios using matching sales revenue. Do not describe a percentage-point change as a relative percentage increase.
In a hypothetical period with $20,000 in sales, theoretical cost of $4,000 is 20%. Actual cost of $4,700 is 23.5%. The gap is $700, or 3.5 percentage points.
Reconcile documented non-sale use and record errors before interpreting the remaining difference. The companion article Actual vs. Theoretical Beverage Cost: Explain the Gap develops this comparison into an investigation process.
Review Negative Variance and Category Offsets
Negative variance means actual cost is below the theoretical expectation, but it still needs review. Possible explanations include under-portions, overstated recipes, omitted purchases, or count errors.
Do not reward a low blended result without checking its components. Positive variance in one product can be offset by negative variance elsewhere, concealing both issues in a property-wide total.
Compare quantities as well as values when supplier costs change. A consistent variance review should distinguish pricing, measurement, mapping, and operational causes rather than treat every difference as missing product.
Improve Purchasing and Stock Availability
Purchasing decisions should use current counts, recent usage, delivery lead times, and expected service demand. Stock availability and cash tied up in inventory both belong in the decision.
Ordering too little can cause substitutions and missed sales. Ordering too much ties up cash and may expose perishable or opened products to waste. Evaluate an extra case against likely use rather than a discount alone.
Consider approved events, reservations, seasonal demand, and supplier delivery schedules. Historical usage informs the order, but it should not be treated as a complete forecast when operating conditions have changed.
Distinguish Par Levels From Reorder Points
A par level is the target quantity you order up to; a reorder point is the stock level that triggers an order. Define both consistently in your operation.
A basic reorder point equals expected demand during lead time plus a safety buffer. In a hypothetical example, usage of two bottles daily, three days of lead time, and four safety-stock bottles produce a ten-bottle reorder point.
For ordering, consider usable stock, confirmed stock already on order, and scheduled requirements. Review the buffer when deliveries or demand become less predictable instead of increasing every product's par indiscriminately.
Investigate Discrepancies Before Assigning Blame
Investigate the records and operating process before attributing a discrepancy to intentional loss. A variance report narrows what needs examination; it does not establish individual responsibility.
Check physical coverage, receiving, transfers, POS mapping, recipes, and documented non-sale use in a consistent sequence. Retain the evidence and correction applied so the next review can confirm whether the issue recurs.
A repeatable beverage audit gives staff a clear process. Share verified findings and expectations, rather than starting a discussion with an accusation based on an aggregate ratio.
Check Counts, Receiving, and Transfers First
Count and movement checks establish whether your actual-usage inputs are reliable. Recount affected items where practical, verify all storage areas, and compare receipts with supplier records.
Check for duplicate invoices, unrecorded credits, unit errors, and deliveries entered in the wrong period. A missing receipt can understate consumption; a duplicate can overstate it. Different errors do not all move variance in the same direction.
Confirm both sides of a transfer and its reporting scope. At outlet level, undocumented movement can appear as a shortage in one location and surplus in another without changing total property stock.
Check Recipes, POS Mapping, and Non-Sale Use
Recipe and sales-mapping checks establish whether your theoretical expectation matches the drinks recorded. Review substitutions, recipe changes, item buttons, and serving quantities for affected products.
Reconcile approved complimentary servings, breakage, spills, returned drinks, and tastings. These explain non-sale consumption when recorded accurately. Keep them in total actual usage, then account for them when calculating the residual unexplained gap.
Review persistent patterns only after correcting the inputs. Escalate concerns through your documented management procedures and applicable policies. An item-level discrepancy is evidence to examine, not permission to assume who caused it.
How Scannabar Supports Inventory and Cost Control
Scannabar supports inventory measurement, stock tracking, and usage reporting for hospitality operations. Those capabilities help connect the physical count with the records used in a cost review.
Scannabar's liquor inventory system provides barcode-enabled measurement and reporting by product and outlet. Its POS reconciliation supports comparison of observed usage with recorded sales.
Use the reports alongside documented receiving, transfers, and recipes. A system can organize inputs and identify discrepancies, but interpreting a gap still requires operational records and a fair investigation.
Build Accountability Around Evidence
Evidence-based accountability makes responsibilities and records visible without treating inventory control as a presumption of misconduct. Define who receives, counts, reviews, and approves adjustments.
Scannabar's inventory controls support product and location visibility. Use that visibility to focus training and reviews on the process that needs improvement.
Let staff explain legitimate stock movements and document the outcome. Close each review with a specific action, owner, and follow-up date. The next period should show whether the correction improved the record or whether further investigation is needed.
Build a Repeatable Cost-Control Routine
A repeatable routine brings count preparation, physical observations, reconciliation, and purchasing review into one scheduled process. Choose a cadence that fits your service volume, risk, and available staff.
More frequent reviews shorten the period you need to investigate, but accuracy matters as much as frequency. A rushed count with unmatched boundaries can create more confusion than a carefully documented one.
Start with a clear operating standard and improve it as recurring exceptions become visible. Each review should leave a retained snapshot, explained adjustments, and named actions rather than only a new percentage.
Use a Count-Period Checklist
A count-period checklist makes the review sequence visible and assigns the evidence needed at each stage. Adapt this sequence to your locations and accounting policy.
Before counting: Confirm receiving, transfers, returns, and sales boundaries; prepare the product and location list.
During counting: Cover every location, use consistent units, record partial quantities, and document exceptions.
After counting: Calculate usage, reconcile sales and non-sale use, and flag unexplained item-level differences.
During management review: Check costs and revenue mix, agree corrective actions, and update purchasing requirements.
Before the next cycle: Confirm actions were completed and retain prior records for comparison.
A checklist should reflect your actual operating procedure. Review omissions and recurring corrections so the process improves rather than reproduces the same exceptions each period.
Build a Connected Inventory and Cost-Control System
Connected inventory control turns counts and movement records into decisions you can explain. Start with a defined scope, reliable units, and matched reporting boundaries.
Then calculate consumption cost, establish recipe-based targets, and investigate variance with evidence. Use the companion articles for deeper calculations and spreadsheet design as each resource becomes available.
Your next step is a documented routine with clear ownership. Consistent reviews support better purchasing and fairer operational decisions while keeping gross margin, net profit, and unexplained usage distinct.
FAQs About Liquor Inventory and Cost Control
Does a high liquor cost percentage prove theft?
No. High cost can reflect pricing, sales mix, supplier changes, record errors, waste, or unauthorized usage. Scannabar's product-level reports help narrow the review, but evidence from counts, movements, recipes, and approved non-sale use is necessary before attributing a discrepancy to anyone.
How often should you count liquor inventory?
Choose a count frequency that fits your volume, risk, and ability to maintain reliable records. Scannabar's counting workflow supports regular reviews. Shorter periods can narrow investigations, but matched boundaries and consistent measurements remain necessary at any cadence.
Can inventory software replace physical observations?
No. Reliable inventory needs trustworthy observations and documented stock movements. Scannabar supports barcode-enabled measurement and usage reporting, but incomplete receiving or transfer records can still distort the result. Use software with a defined operating routine and retained review evidence.
Is there one correct liquor cost target?
No. Your target depends on recipes, ingredient costs, prices, and revenue mix. A recipe-based target provides a defensible starting point. Compare actual consumption with that expectation and investigate changes before assuming a published average is appropriate for your operation.
Should waste be excluded from actual usage cost?
No. Waste consumes product and remains part of inventory-derived usage cost. Document it separately so you can explain the gap between physical consumption and sales-based theoretical usage. Deduct documented non-sale use when analyzing residual unexplained variance, not when measuring total consumption.
Discover how outdated manual inventory practices are costing your bar time, money, and competitive advantage in today's fast-paced hospitality environment.
The Hidden Costs of Counting by Hand
When you think about the cost of manual inventory counts, the first thing that comes to mind is probably labor hours. But the true expense goes far deeper than what you're paying your staff to physically count bottles. Manual inventory counts create a cascade of hidden costs that silently erode your profit margins month after month.
Every hour your bartenders or managers spend counting bottles is an hour they're not engaging with customers, training staff, or focusing on revenue-generating activities. Beyond direct labor costs, manual counts often require you to conduct inventory during off-hours or when the bar is closed, potentially requiring overtime pay or pulling staff away from their primary responsibilities. Additionally, the physical strain of manually counting hundreds of bottles can lead to employee fatigue and burnout, increasing turnover rates in an industry already notorious for staffing challenges.
Perhaps the most insidious hidden cost is the opportunity cost of delayed decision-making. When your inventory data is days or weeks old by the time it's compiled and analyzed, you're essentially flying blind. You might be over-ordering products that aren't selling, missing out on popular items that could drive more revenue, or failing to catch theft and waste until it's too late to intervene. Bar inventory software eliminates these hidden costs by providing accurate, immediate data that empowers better business decisions.
How Human Error Drains Your Bottom Line
No matter how diligent your team is, human error is an inevitable part of manual inventory counts. A bartender counting bottles at the end of a long shift might miscount by a few units here and there, or accidentally skip a shelf entirely. Someone might record a number in the wrong column, transpose digits, or simply misread a label in poor lighting. These small mistakes compound quickly when you're managing hundreds of SKUs across spirits, beer, wine, and mixers.
The financial impact of these errors can be staggering. A study in the hospitality industry found that inventory inaccuracies can cost businesses between 1-3% of their total revenue. For a bar generating $500,000 annually, that's up to $15,000 disappearing due to counting mistakes alone. These errors create false shortages that lead to over-ordering, tying up valuable capital in excess inventory. Conversely, miscounts can result in stockouts of popular items during peak hours, directly impacting customer satisfaction and sales.
Manual inventory counts also make it nearly impossible to identify patterns of theft, over-pouring, or waste. When your baseline data is inaccurate, you can't reliably measure variance or investigate discrepancies. A liquor inventory app eliminates the guesswork by using barcode scanning, weight sensors, or other automated tracking methods that remove human error from the equation. With accurate data, you can finally pinpoint exactly where your inventory is going and take corrective action to protect your profits.
Time is Money: The Productivity Problem
Ask any bar manager how long it takes to complete a full manual inventory count, and you'll likely hear estimates ranging from 3 to 8 hours, depending on the size of the establishment. For many bars, this means dedicating an entire shift to inventory—typically after closing when staff are already exhausted. The process is tedious: walking through storage areas, counting bottles, recording numbers on clipboards or spreadsheets, then manually entering all that data into a computer system for analysis.
This time investment represents a massive drain on productivity and operational efficiency. Consider that most bars should be conducting inventory at least weekly, if not more frequently, to maintain accurate stock levels and quickly identify issues. That's potentially 32 hours per month dedicated solely to counting—time that could be spent improving bar operations efficiency through staff training, menu development, marketing initiatives, or simply providing better customer service during operating hours.
The productivity problem extends beyond the counting process itself. Once the manual count is complete, someone still needs to compile the data, calculate variances, identify reorder points, and generate reports for management review. This additional administrative work can add several more hours to the process. Modern bar inventory software reduces a task that once took hours down to mere minutes. With mobile apps that enable quick scanning and automatic calculations, your team can complete accurate inventory counts in a fraction of the time, freeing them up to focus on what really matters: creating exceptional experiences for your guests and growing your business.
Missing Out on Real-Time Data Insights
In today's data-driven business environment, making decisions based on week-old information is like driving while looking in the rearview mirror. Manual inventory counts are inherently backward-looking, providing a snapshot of what your stock levels were days ago rather than what they are right now. By the time you've completed your count, entered the data, and generated reports, the information is already outdated, and market conditions may have shifted dramatically.
Without real-time data insights, you're unable to respond quickly to emerging trends or sudden changes in demand. You can't immediately identify which cocktails are driving the most profit, which bottles are moving slowly and tying up capital, or which suppliers are consistently delivering quality products on time. You're also missing the ability to track pour costs accurately, compare actual usage against sales data to identify discrepancies, or monitor staff performance metrics that could reveal training opportunities or theft.
Bar inventory software transforms your operation from reactive to proactive by providing instant access to critical business intelligence. Real-time dashboards show you at a glance which items are running low, what your current pour costs are across different categories, and how today's sales compare to previous periods. You can set automatic reorder alerts so you never run out of best-selling items, track trends over time to optimize your menu offerings, and make data-driven purchasing decisions that maximize profitability. This level of insight simply isn't possible with manual inventory counts, putting bars that rely on outdated methods at a significant competitive disadvantage in an increasingly sophisticated market.
Making the Switch to Automated Inventory Management
Transitioning from manual inventory counts to automated systems might seem daunting, but the process is more straightforward than many bar owners imagine. Modern bar inventory software is designed with user-friendliness in mind, offering intuitive interfaces that require minimal training. The first step is selecting a solution that fits your specific needs—whether that's a comprehensive system that integrates with your POS and accounting software, or a streamlined liquor inventory app focused solely on tracking bottles and generating reports.
Implementation typically begins with an initial setup phase where you'll catalog all your products into the system, establish par levels for each item, and configure integrations with existing tools. Many software providers offer onboarding support to help you through this process, ensuring data accuracy from day one. Once configured, your staff can begin using mobile devices to scan barcodes or quickly input inventory levels, with the system automatically calculating variances, suggesting reorder quantities, and flagging potential issues for investigation.
The return on investment for bar inventory software is typically realized within just a few months. The combination of time savings, reduced errors, prevention of theft and waste, and optimized purchasing decisions creates multiple revenue streams that quickly offset the software subscription costs. Beyond the financial benefits, you'll notice improvements in staff morale as employees are freed from the tedium of manual counting, better supplier relationships through more accurate and timely ordering, and enhanced overall bar operations efficiency that positions your establishment for sustainable growth. The question isn't whether you can afford to invest in automated inventory management—it's whether you can afford to keep falling behind competitors who have already made the switch.
Discover the hidden ways employees may be stealing from your bar and how to prevent it.
Understanding the impact of employee theft in bars
Employee theft in bars can have a significant impact on the business, both financially and reputationally. The stolen items or money can result in immediate losses for the bar, affecting its profitability. Additionally, employee theft can damage the trust and loyalty of customers, leading to a decline in patronage. It is crucial for bar owners to understand the negative consequences of employee theft in order to take appropriate measures to prevent it.
Another paragraph about understanding the impact of employee theft in bars.
Common methods of employee theft in bars
There are various common methods that employees may use to steal from bars. One method is skimming, where employees take cash directly from the register before it is recorded. Another method is over-pouring, where bartenders pour excessive amounts of alcohol into drinks and pocket the difference. Employees may also engage in undercharging, where they deliberately charge customers less than the actual price of the items. Additionally, theft of inventory such as liquor bottles or food supplies is another common method of employee theft in bars.
Another paragraph about common methods of employee theft in bars.
Signs to look out for in detecting employee theft
There are several signs that bar owners can look out for to detect employee theft. One sign is a discrepancy between the amount of cash recorded in the register and the actual cash on hand. If the numbers don't match up, it could be an indication of theft. Another sign is a sudden increase in inventory shrinkage or missing items. Unexplained changes in employee behavior, such as a reluctance to take time off or a sudden change in personal appearance, can also be red flags. It is important to be vigilant and observant to identify potential signs of employee theft.
Another paragraph about signs to look out for in detecting employee theft.
Preventative measures to combat employee theft
To combat employee theft in bars, there are several preventative measures that can be implemented. First and foremost, it is important to have a strong hiring process in place, including thorough background checks and reference checks. Implementing a system of checks and balances, such as having multiple employees involved in cash handling and inventory management, can help deter theft. Regular inventory audits and surprise cash register counts can also help identify any discrepancies. Proper training and clear communication of expectations can also play a crucial role in preventing employee theft.
Another paragraph about preventative measures to combat employee theft.
Legal implications and consequences of employee theft in bars
Employee theft in bars can have serious legal implications and consequences. Depending on the severity of the theft, employees can face criminal charges and potential jail time. Bar owners may also pursue civil litigation to recover damages caused by the theft. In addition to legal consequences, employee theft can result in termination of employment and damage to the employee's professional reputation. It is important for both bar owners and employees to be aware of the potential legal ramifications of employee theft.
Another paragraph about legal implications and consequences of employee theft in bars.
Discover effective strategies for optimizing your liquor cost and maximizing profits through smart pricing strategies for your drink menu.
Understanding the importance of pricing in the liquor industry
Pricing plays a crucial role in the success of any business, and the liquor industry is no exception. Setting the right price for your drinks can significantly impact your profitability and overall success. It is essential to understand the importance of pricing and how it can affect your bottom line.
When it comes to pricing your drink menu, there are several factors you need to consider. These include the cost of the liquor, overhead expenses, competition, and customer demand. By carefully analyzing these factors, you can determine the optimal pricing strategy for your drinks.
Additionally, pricing can also influence customer perception and behavior. A well-priced drink menu can attract more customers and encourage them to spend more, ultimately leading to increased revenue. On the other hand, poorly priced drinks can drive customers away and negatively impact your business. Therefore, understanding the importance of pricing in the liquor industry is crucial for your success.
Analyzing your costs to determine optimal pricing
Before you can set the right price for your drinks, it is essential to analyze your costs. This involves calculating the liquor cost, which is the cost of the alcohol used in each drink. By understanding your liquor cost, you can determine how much you need to sell each drink to cover your expenses and make a profit.
To calculate liquor cost, you need to consider the price you pay for each bottle of liquor, the volume of alcohol used in each drink, and any other ingredients or garnishes. By accurately tracking these costs, you can determine the optimal pricing for your drinks.
In addition to liquor cost, you should also consider other expenses such as overhead costs, including rent, utilities, and employee salaries. These costs should be factored into your pricing strategy to ensure you are covering all your expenses and making a profit.
Analyzing your costs is a crucial step in determining the optimal pricing for your drink menu. By understanding your expenses and accurately calculating your liquor cost, you can set the right price that balances profitability and customer value.
Exploring pricing strategies for different types of drinks
Different types of drinks require different pricing strategies. It is important to consider the cost of ingredients, complexity of preparation, and customer demand when pricing each drink category on your menu.
For example, high-end spirits and specialty cocktails often have higher liquor costs and require more time and skill to prepare. These drinks can be priced at a premium to reflect their quality and exclusivity. On the other hand, well drinks, which typically use lower-cost liquors, can be priced more affordably to attract price-conscious customers.
When pricing your drink menu, it is also important to consider the perceived value of each drink. Customers are often willing to pay more for drinks that are presented in an appealing way or have unique features. By strategically pricing drinks with higher perceived value, you can increase your profitability.
Exploring different pricing strategies for different types of drinks can help you optimize your menu and maximize your profits. By understanding the cost and demand for each drink category, you can set prices that attract customers while ensuring profitability.
Leveraging menu design and psychology to influence purchasing decisions
Menu design and psychology play a significant role in influencing customer purchasing decisions. By strategically designing your drink menu, you can guide customers towards certain choices and increase sales.
One effective strategy is to highlight certain drinks or create sections that draw attention. For example, you can feature signature cocktails or seasonal drinks in a prominent section of your menu. By showcasing these drinks, you can increase their perceived value and encourage customers to try them.
Another strategy is to use pricing techniques such as anchoring and decoy pricing. Anchoring involves placing a high-priced item next to a lower-priced item, making the lower-priced item seem more affordable. Decoy pricing involves offering three options, with the middle option being strategically priced to make the highest-priced option seem like a better value. These techniques can influence customers to choose certain drinks and increase your sales.
By leveraging menu design and psychology, you can influence customer purchasing decisions and increase your profitability. Strategic placement, highlighting certain drinks, and using pricing techniques can all contribute to a successful drink menu.
Monitoring and adjusting your pricing strategy for maximum profitability
Setting the right prices for your drink menu is not a one-time task. It is essential to continuously monitor and adjust your pricing strategy to ensure maximum profitability.
Regularly reviewing your costs, competition, and customer demand can help you identify opportunities for price adjustments. For example, if the cost of a particular liquor increases, you may need to adjust the price of drinks that use that liquor to maintain profitability. Similarly, if you notice a high demand for certain drinks, you can consider increasing their prices to maximize profit.
Customer feedback and sales data can also provide valuable insights into the effectiveness of your pricing strategy. If customers consistently complain about prices or if certain drinks are not selling well, it may be a sign that adjustments are needed.
By monitoring and adjusting your pricing strategy, you can ensure that your drink menu remains profitable and competitive. Regularly analyzing your costs, staying updated on market trends, and listening to customer feedback are all essential for maintaining maximum profitability.
At the end of each month, it is important to close out all expenses and sales and balance all accounts. This process ensures that finances are being monitored and helps prevent financial problems down the line. It also lets you, the bar manager, see whether the bar is making a profit or not and what changes (if any) need to be made to operations.
Closeout actually depends on what goes on financially in your bar all month. It is essential that all expenses are recorded each day. Not having a reliable list of expenses incurred is sure to result in inaccurate bookkeeping and many problems at audit time. You need to record all expenses—including those that are prepaid or those for which you get a bill.
Monthly Audit Procedures
On the last day of the month:
1. Gather the completed inventory forms for food, liquor, wine, and operational supplies.
2. Using current invoices and past inventories, cost out the Inventory Form. The unit cost (or price) entered on the Inventory Form must correspond to the item and unit in the actual inventory. Correct prices are ensured by continual evaluation of invoices and/or contact with the suppliers.
3. Ensure that the employees organize and clean the storage areas and walk-ins so that the ending inventory may easily be taken the following morning. Combine all containers and bottles. Organize and label all shelves.
4. Schedule the bookkeeper and the employees involved in taking the physical inventory—the assistant manager, kitchen director, bar manager, and general manager—to arrive early in the morning prior to the start of business on the first of the month.
5. Schedule the preparation cooks to arrive an hour after the inventory crew so that you may inventory the food areas without disturbing them.
On the following morning, the first of the month:
6. The bookkeeper should arrive as early as possible in order to complete all of his or her work prior to management's completion of the inventory:
A. Reconcile and record all the transactions from the previous day, as usual.
B. Enter the information on the Daily Sales Report Form. Total, double-check, and verify all the columns.
C. From the employee time cards complete, total, double-check, and verify the Labor Analysis Form.
D. Ensure that all purchases are recorded in the Purchase Ledger. Complete, total, double-check, and verify the Purchase Ledger for each company. Total the purchases in each expenditure category: food, liquor, wine, and each individual operational category.
Ensure that all paid-outs entered on the Cashier's and Bartender's Reports have been posted into the appropriate Purchase Ledger categories. Total the cash paid-outs. Add this figure into the purchase total for each expense category.
This article is an excerpt from the The Professional Bar & Beverage Managers Handbook: How to Open and Operate a Financially Successful Bar, Tavern and Nightclub, authored by Douglas Robert Brown, published by Atlantic Publishing Group. This excerpt has been reprinted with permission of the publisher. To purchase this book go to:
How Keeping Close Tabs On Your Liquor Supply Can Both Cut Costs & Generate Revenue
Industry studies have consistently shown that a full 25% to 30% of a bar's liquor inventory never converts into registered sales. That is the equivalent of about six to eight 1.25 oz portions per bottle (which should yield at least 25 portions.) This loss of liquor volume--due to unauthorized comps, over-pouring, spillage or theft--should be of great concern to any bar manager.
While losing 25% of a $25 bottle may not seem like a very serious problem--an unavoidable cost of doing business--the true cost is much greater than that $6 or $7 per bottle. The question you need to ask yourself is: Where is this lost liquor going? And how is it affecting sales? For instance, if your bartender is not pouring 1.25 oz portions, but is instead pouring 2 oz portions (say, perhaps, to curry favor with clients and receive a bigger tip), you're not just losing liquor volume, you're also losing potential sales. Where the customer may have been disposed to buy three drinks (3.75 ounces), he may now be content to buy just two 2-ounce drinks. Your bartender's actions, in this case, haven't merely cost you a dollar's worth of liquor, they may well have cost you $6-$8 in lost sales revenue (depending on how you price your drinks). And that's just for one customer buying two drinks. How often is this occurring? What if your bartender also happens to be giving away free drinks without your knowledge or authorization? The point is: "shrinkage" does not only affect supply costs, it can also affect revenues in a big way.
That's why loss prevention is so important. The profitability of your business depends on whole bunch of variables--the location of your establishment, the overall economy, ever-changing customer tastes.... Achieving profit growth can be difficult and can rarely be accomplished overnight. Increasing the price of your drinks is risky, and can prove more harmful than helpful as far as your bottom line is concerned. And growing your clientele usually takes time. The best way to increase profits in the short-term, therefore, is not to try to fiddle with pricing or to increase your client base. (Of course, this is something you should always be doing. But it is not easy to do in the short-term.) The quickest way to increase revenue is to make the most of the clients you're already serving. And one way to do this is to improve operations by getting tighter grip on your inventory. Loss of liquor supply at double-digit levels is not an "unavoidable cost of doing business". It is "bad business". And it is entirely avoidable. Put simply, loss prevention can pay big dividends. What's more, it can be achieved quite quickly through the implementation of a quality liquor inventory control system.
What does each drink cost you?Without profits, you're out of business, but so many managers see profits as what the owners worry about. Your job is as much to grow profits as to sustain them, so consider putting a little elbow grease into the growth of your establishment by learning about the nickel and dime stuff. A good bar operator needs to wear a number of hats, but the four most important are that of promoter, psychologist, host and accountant. This isn't to say that you need to be of professional standard in all four areas, but you do need a working knowledge of each area, so that you can fine-tune those aspects of your business. On the accounting side of things, you need to be able to assess what every piece of your business costs. Also, as your spirits and liqueurs are a very large segment of your inventory, you should learn exactly how much each and every drink you sell actually costs you. Follow these exercises and you'll be able to assess exactly which drinks bring you the highest profit margin and which drinks could use a price increase.
Cost per ounce. There is 33.8 ounces in a liter, so if you're paying $15 a liter for a certain spirit, simply dividing that amount by 33.8 will bring you the beverage's ounce cost (in this case, $0.44). If your bottle size is 750ml, then divide the bottle cost by 25.35 to get the ounce cost. Likewise, dividing a 500ml bottle by 16.9 will give you that product's ounce cost.
Total beverage cost. When calculating what it costs you to provide a mixed drink to a customer, simply figure out the ounce cost of each item in the drink. A half-shot means adding half the ounce cost of that shot, whereas a double shot would mean doubling the ounce cost. Make sure to include every aspect of the drink, such as mixers, dashes of cordial and garnishes. The total of each of these ounce costs will be your "beverage cost" for that drink.
Cost percentage. When you're investing in inventory, you want to know that you're getting a good return on your money and the best way to figure out your percentage return is to estimate your cost percentage for each drink you sell. Simply divide your ounce cost (or bottle cost) by the sale price you've set for that item and then multiply that number by 100. The total will tell you exactly what percentage of the final drink price you are spending on the purchase of its raw contents. The lower the number, the more profit you're making.
Gross profitmargin. To figure out each item's gross profit, simply deduct the cost price from the sale price. To figure out your gross profit margin, take the gross profit, divide it by the sales price and multiply it by 100. The figure remaining is your gross profit margin. You may well find it varies greatly from beverage to beverage. This will tell you which items have a high enough profit margin to push on your customers and which items are just making up the numbers.
This article is an excerpt from the Food Service Professional Guide to Bar & Beverage Operation, authored by Chris Parry, published by Atlantic Publishing Company. This excerpt has been reprinted with permission of the publisher. To purchase this book go to:


 At the end of each month, it is important to close out all expenses and sales and balance all accounts. This process ensures that finances are being monitored and helps prevent financial problems down the line. It also lets you, the bar manager, see whether the bar is making a profit or not and what changes (if any) need to be made to operations.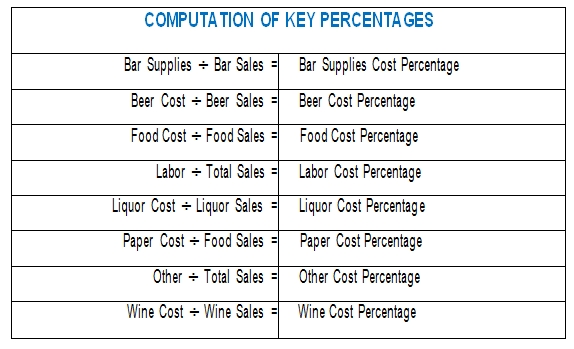
 Industry studies have consistently shown that a full 25% to 30% of a bar's liquor inventory never converts into registered sales. That is the equivalent of about six to eight 1.25 oz portions per bottle (which should yield at least 25 portions.) This loss of liquor volume--due to unauthorized comps, over-pouring, spillage or theft--should be of great concern to any bar manager.
  By Chris Parry