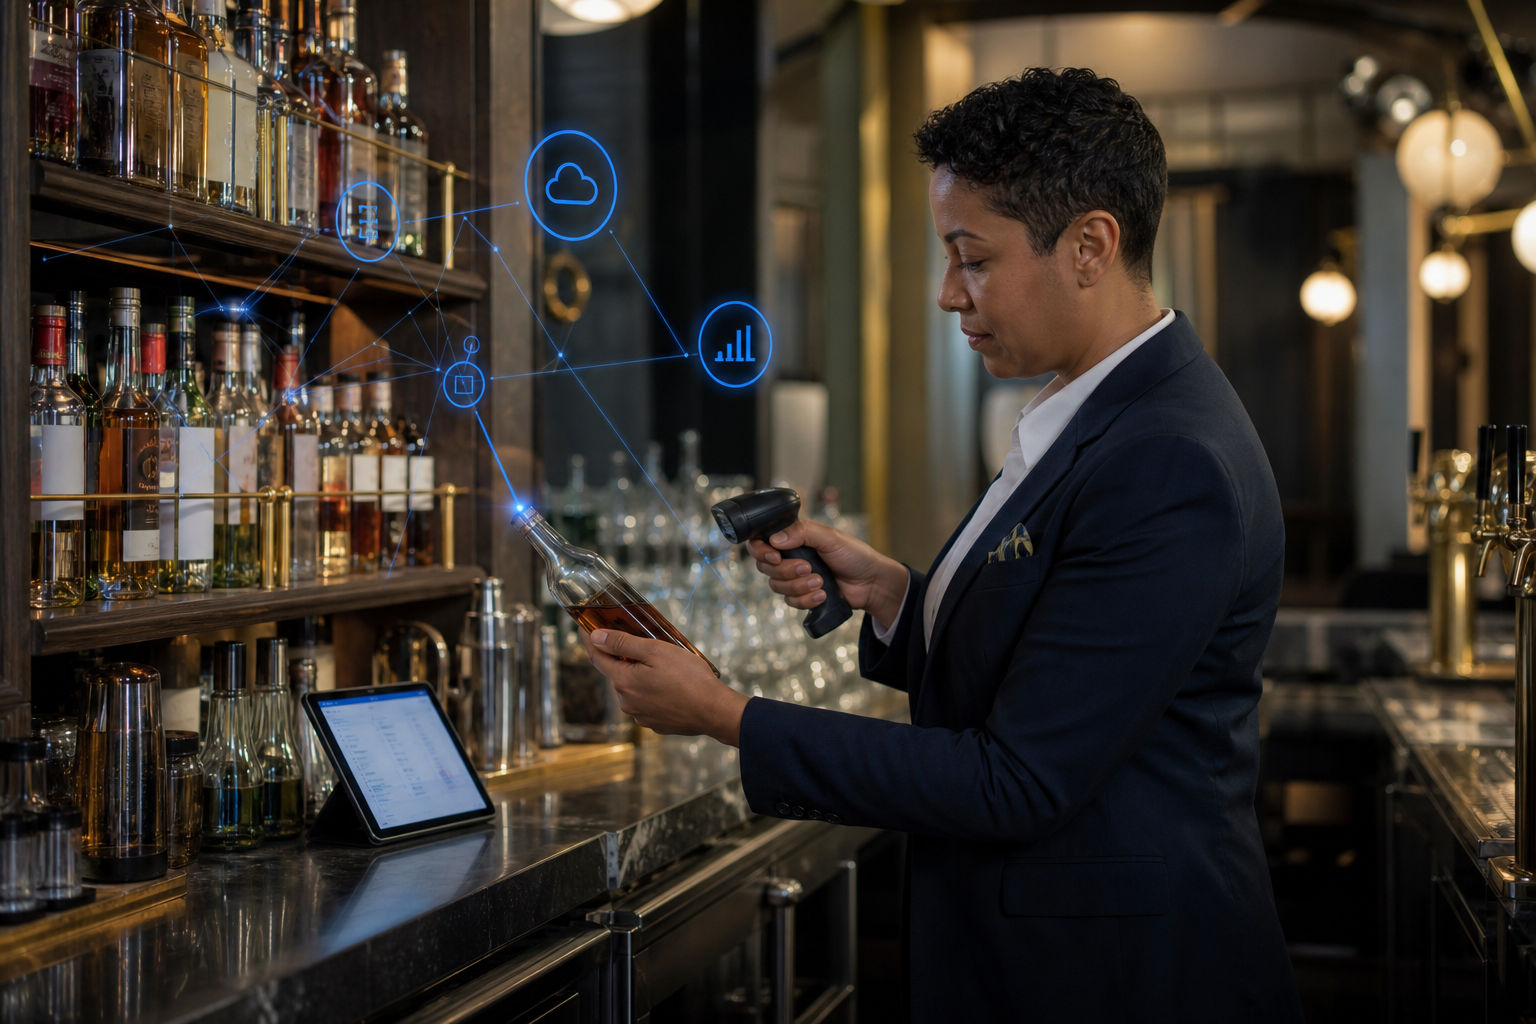
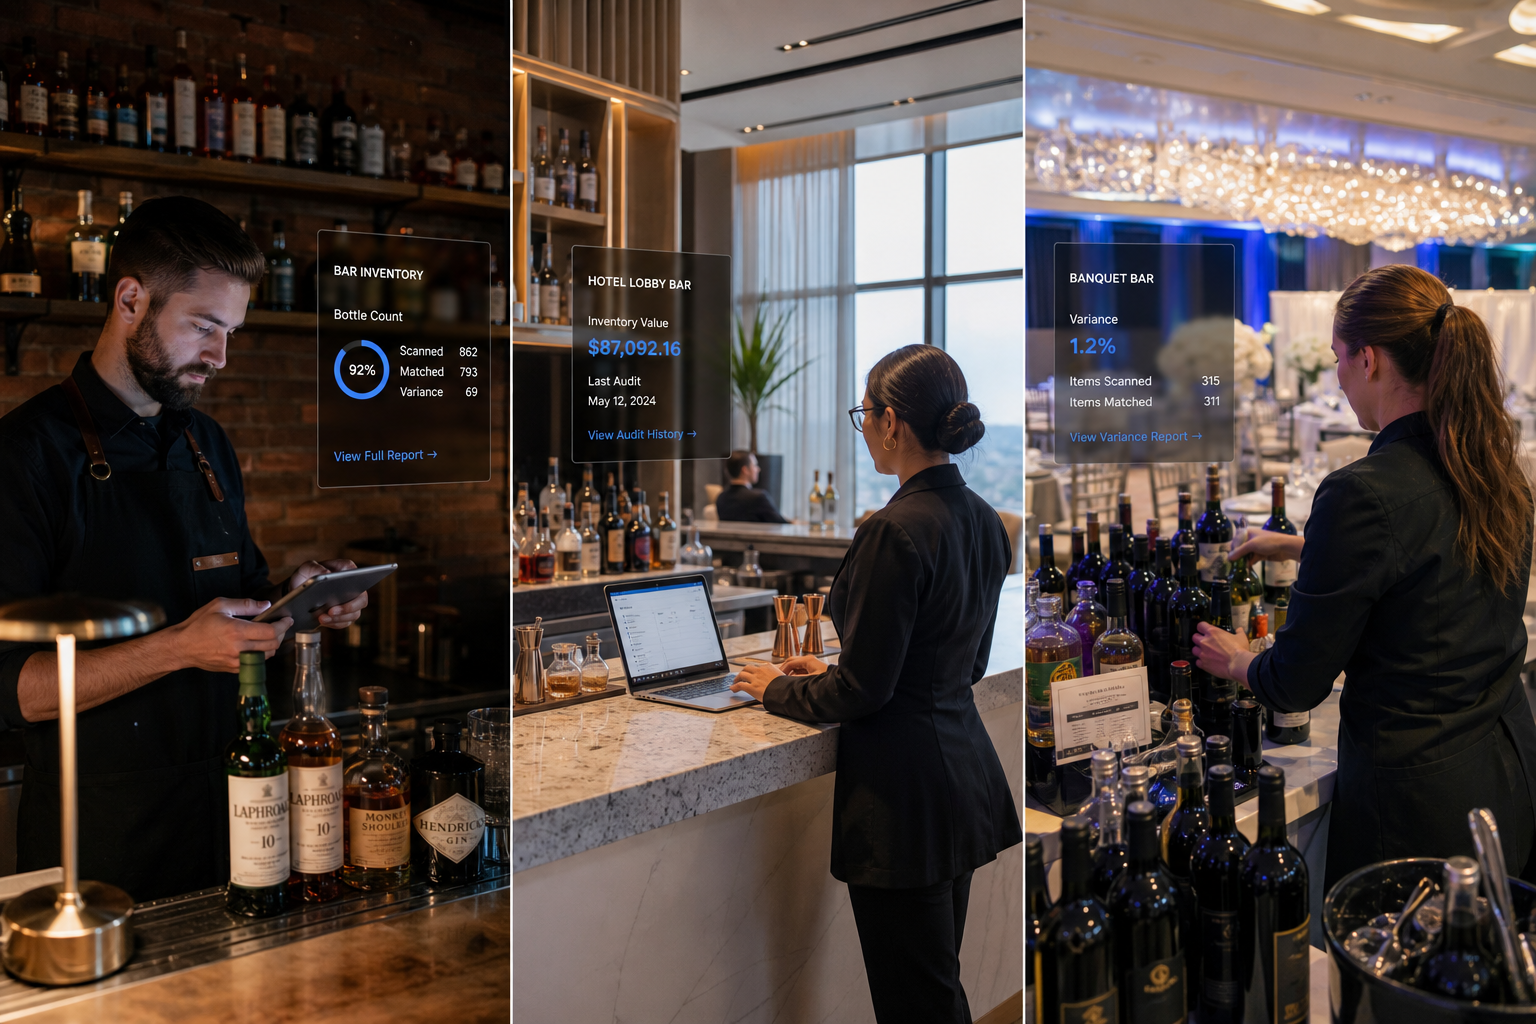
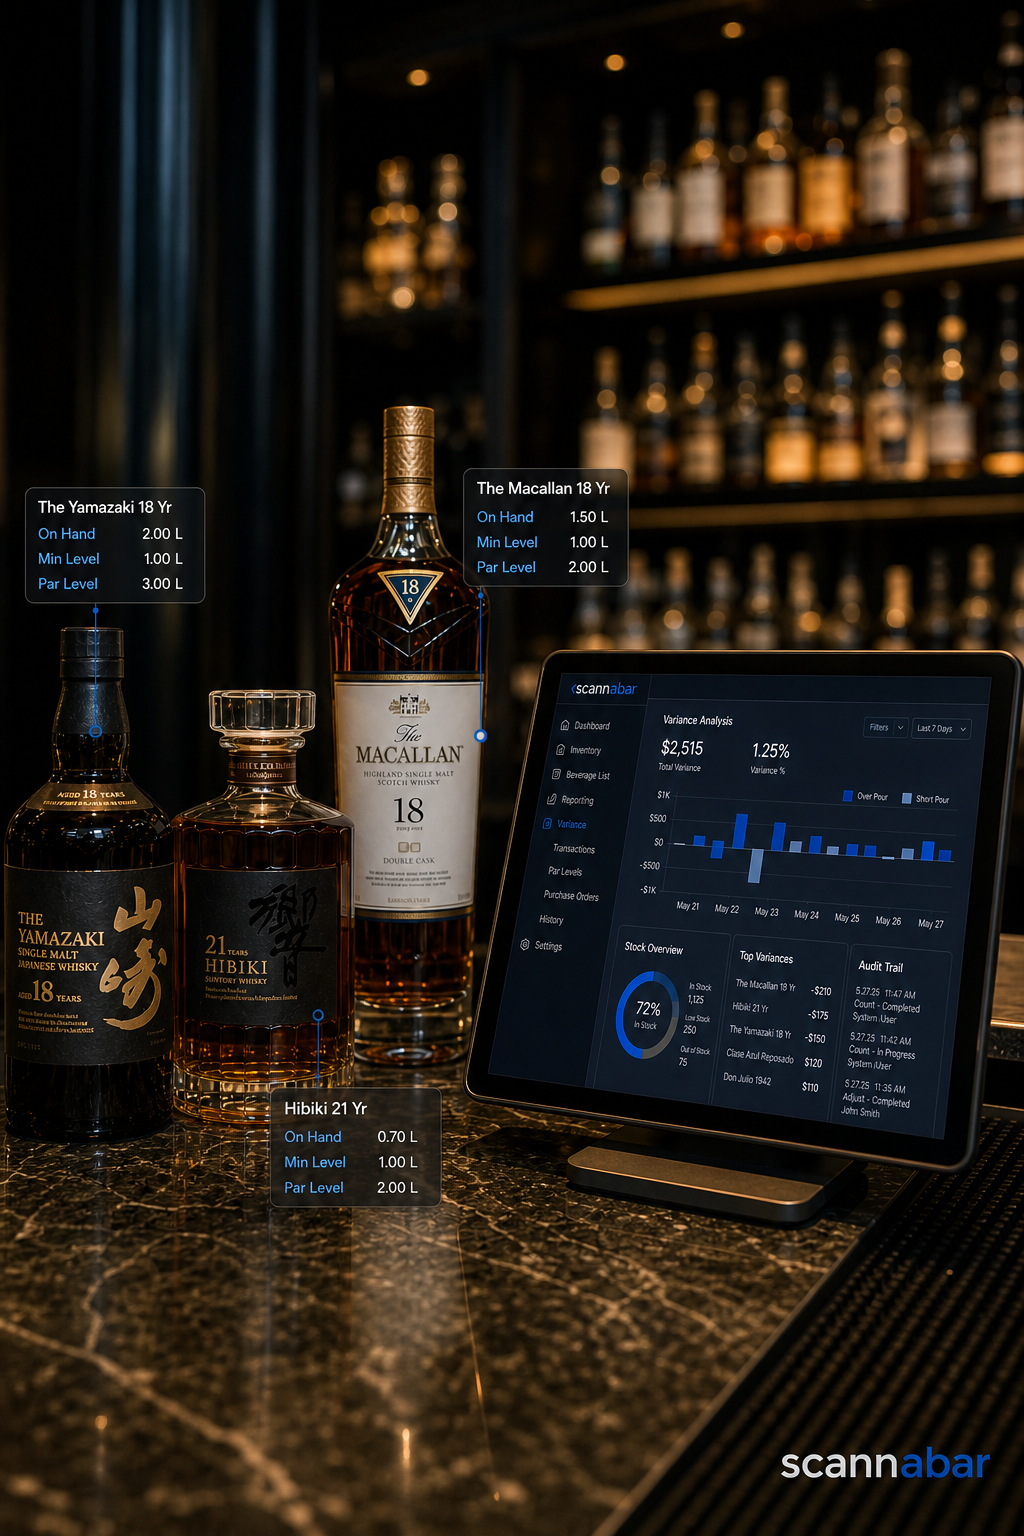
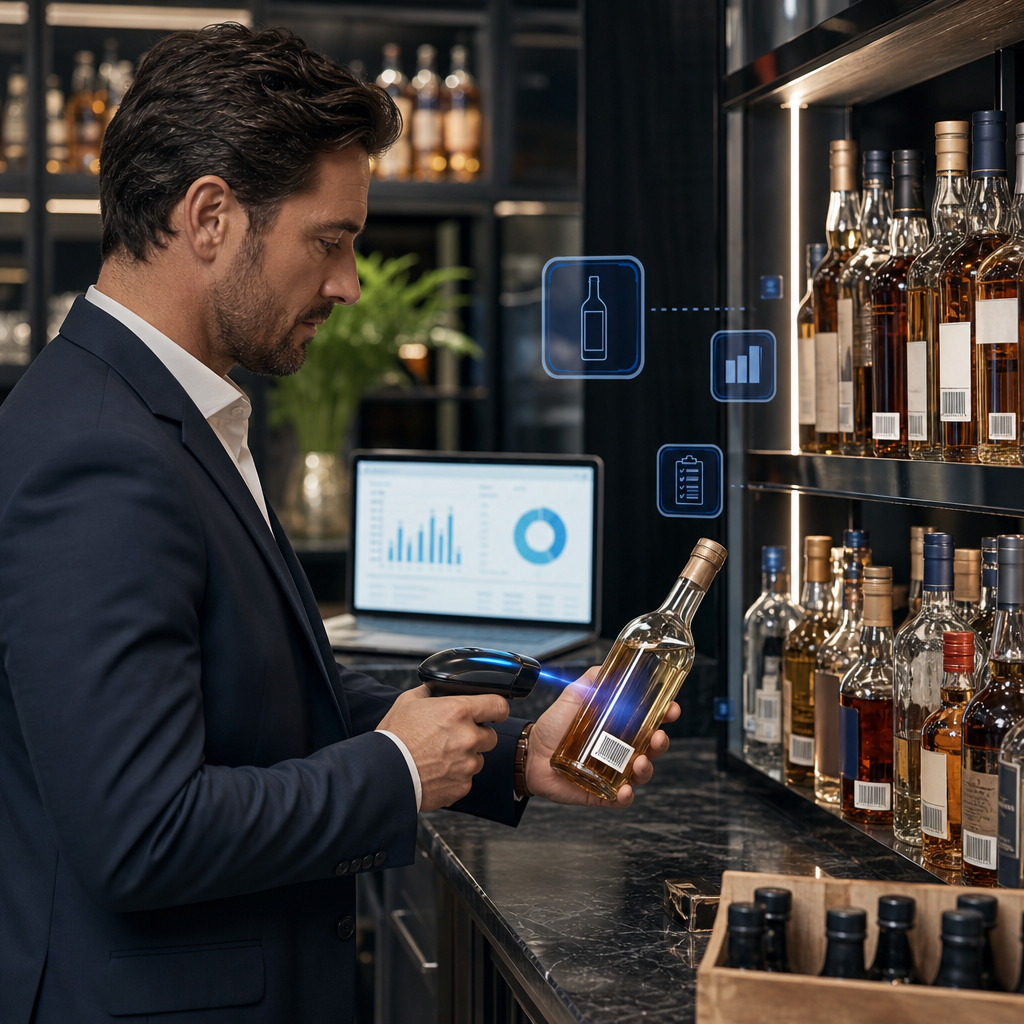
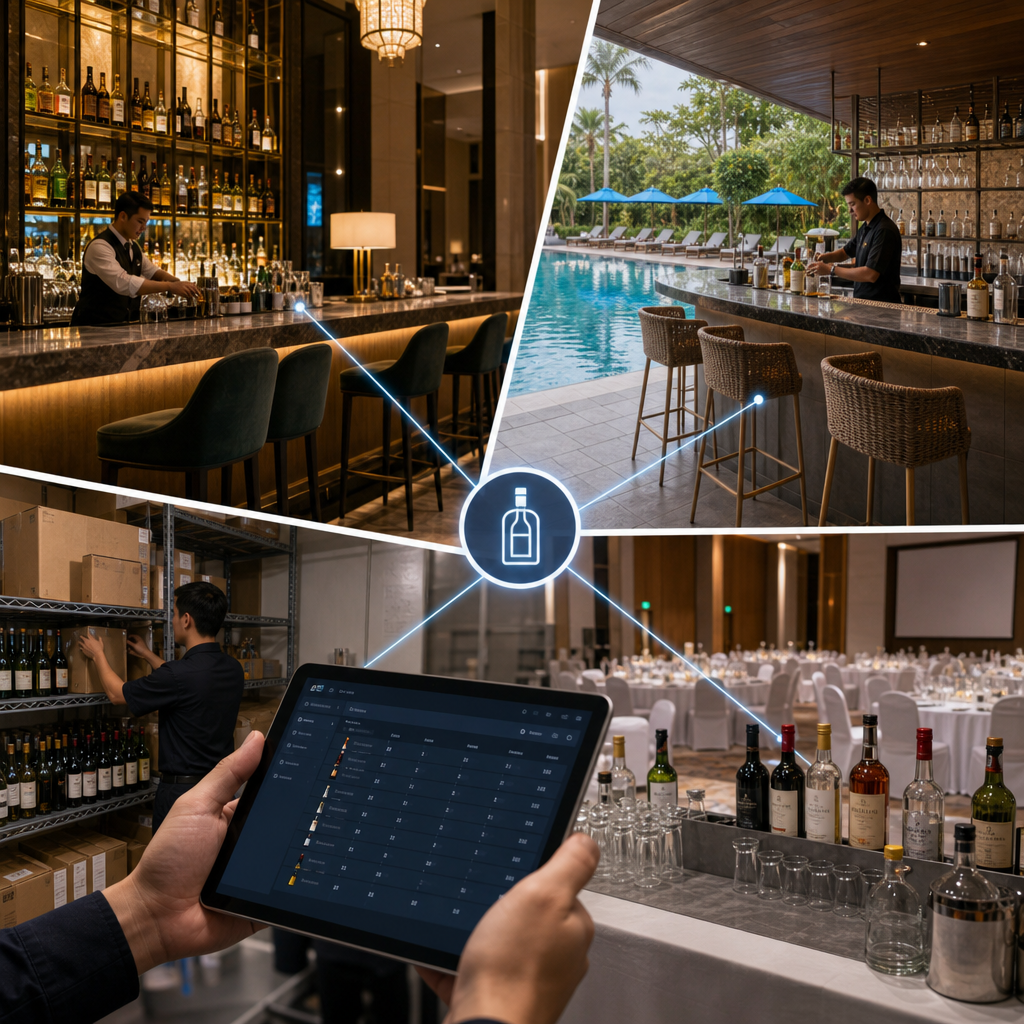
A full room does not guarantee a profitable bar. If the main station runs out of a fast-moving spirit while another station has excess stock, service slows and the next order may never happen. If bottles move between stations without a record, the morning count becomes harder to explain.
This guide gives bar and nightclub managers a repeatable event-night stock plan. Scannabar helps bring measured inventory and usage reporting into that plan, while your team remains responsible for documenting what moves during service.
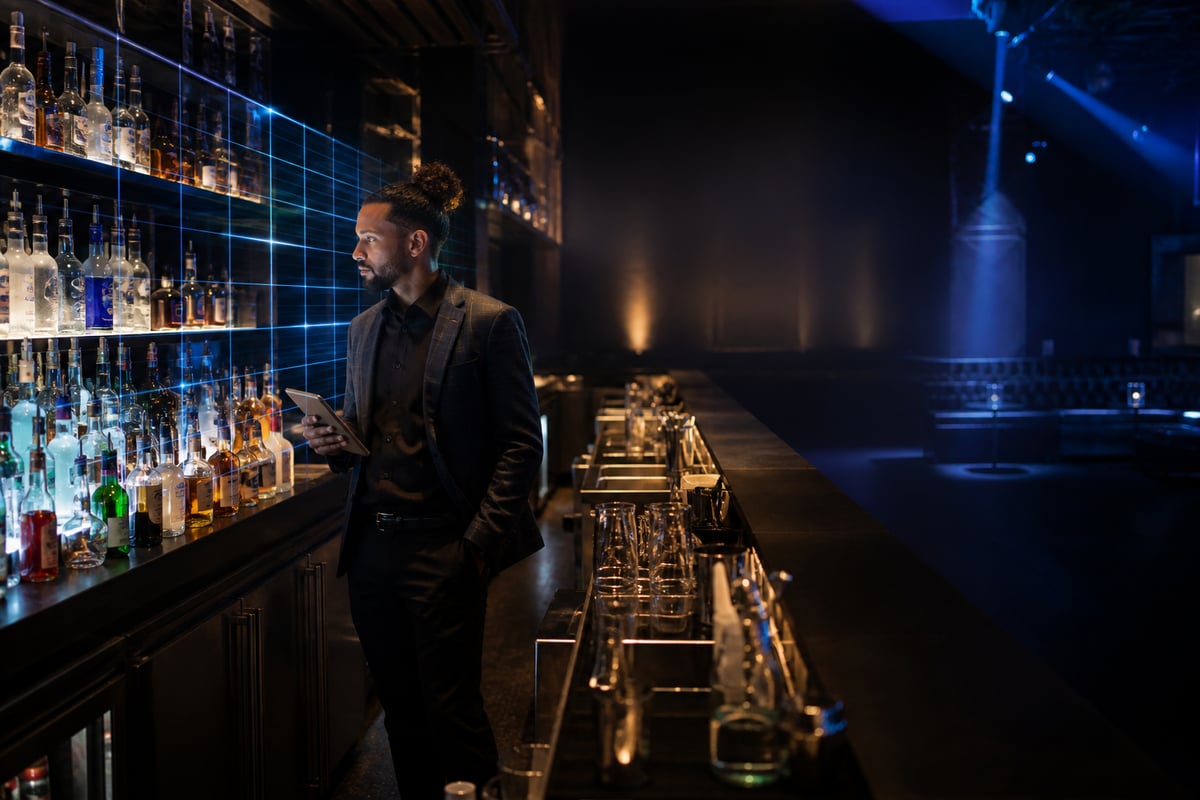
Prepare each station for the night ahead.
Key Takeaways: Nightclub Event Inventory
Plan each station around its own expected sales mix rather than dividing the same stock evenly across the venue.
Keep a reserve near the floor and assign one clear process for documenting replenishment and inter-bar transfers.
Record opening stock, movements, sales, and closing stock to make event-night variance easier to investigate.
Review discrepancies before assuming theft; an unlogged transfer, breakage, or POS mapping error can also explain a gap.
Scannabar supports barcode-based counts and inventory reporting that help managers compare usage across count periods.
Why a Packed Night Can Still Lose Beverage Revenue
Demand shifts rapidly at a nightclub. An unexpected rush at one station can leave a bartender looking for a replacement bottle while stock sits elsewhere. An undocumented pull from storage then makes the closing count look like a loss. The visible cost is delayed service; the less visible cost is a variance you cannot assign to a cause.
Suppose an event starts with 12 bottles of a spirit at one station, receives four more, and closes with five. Eleven bottle-equivalents were used or moved. That is an accounting example, not a loss figure: compare it with recorded transfers, measured partial bottles, and sales and pour practices before drawing conclusions.
Build an Event-Specific Stock Plan Before Doors Open
Start with comparable events: similar attendance, service hours, and drink mix. The National Restaurant Association recommends using inventory reporting to track usage trends and waste. Review product velocity in your POS system, then set a starting par level and a separate replenishment reserve for each station. Keep the assumptions visible so the closing team can say what changed.
Set Par Levels by Station
A main bar serving straightforward mixed drinks may need a different spirit mix from a quieter lounge. Use each station’s sales history rather than a building-wide average. If a station used 18 bottles of a particular SKU during a similar event, a starting par of 20 is one possible planning assumption, not a universal formula. Adjust it for expected demand and the ease of replenishment.
Reserve Stock for Rapid Replenishment
Stage reserve stock by SKU in a known location and give barbacks a simple transfer log. Each pull should show the item, quantity, source, destination, and time. This is a team procedure, not a claim that Scannabar automatically records every transfer. Good documentation lets the physical count tell a clearer story.
Track Stock Movement While the Room Is Busy
During service, the transfer process has to be simple enough to survive a rush. One person can record pulls at the storage point while floor staff focus on guests. Spot-check high-value or fast-moving SKUs during a lull, especially when replenishment differs from the pre-event plan.
Scannabar’s barcode-enabled inventory approach supports faster stock checks and usage visibility. Use those counts alongside the team’s movement log rather than treating a count alone as proof of where a bottle went.
Reconcile the Night Before Planning the Next Event
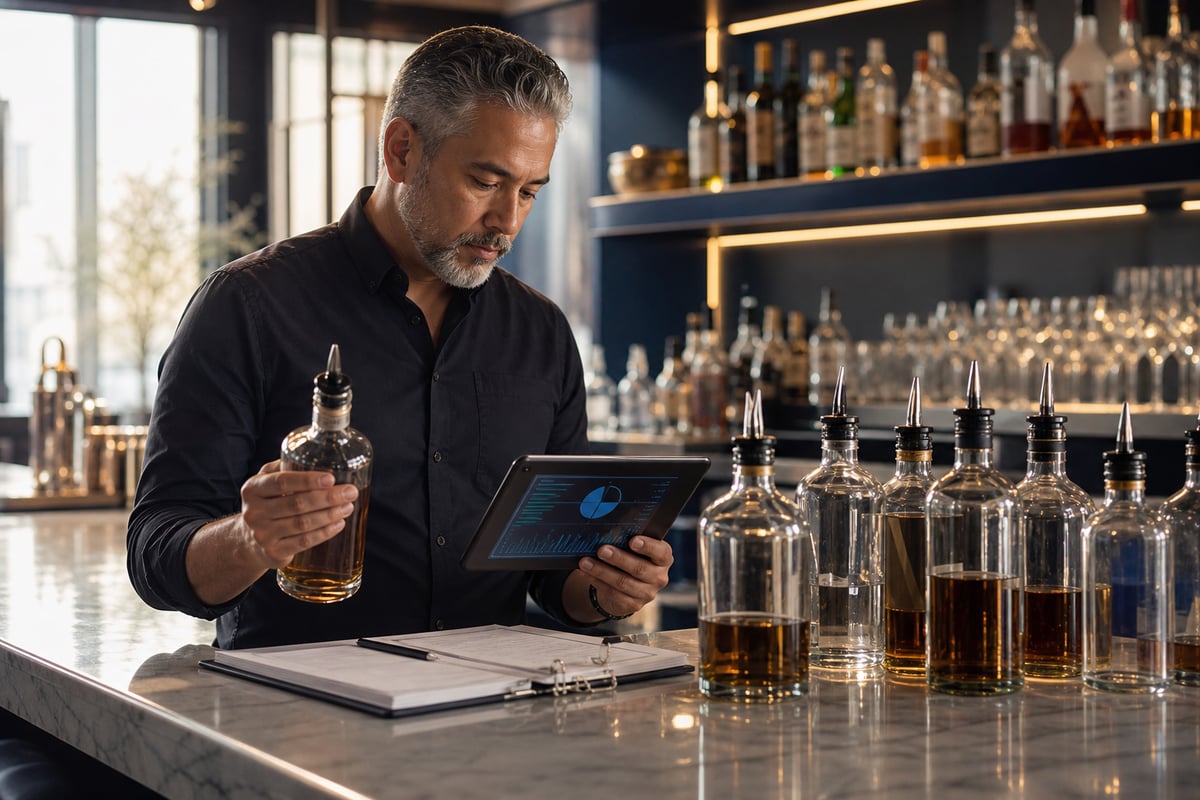
Reconcile event stock while the details are fresh.
Count each station and the reserve after service, ideally before new deliveries or transfers change the picture. Compare opening inventory plus receipts and transfers in, less transfers out and closing inventory, with expected usage from sales. Document breakage, comps, and other known exceptions separately.
Scannabar’s variance reporting helps identify products whose measured usage deserves a closer look. The question is not whom to blame first. It is whether the discrepancy reflects an unrecorded movement, a POS mismatch, a counting error, waste, or theft. A consistent review also protects staff from unsupported accusations.
Turn One Event’s Data into a Better Next Shift
Compare which products ran short, which sat untouched, and which showed unexplained variance. Update par levels for the next similar event and discuss exceptions with the staff who worked the shift. Over several events, those comparisons can make purchasing and station placement more precise.
Scannabar’s inventory planning and usage insights give managers a better starting point than memory alone. The transfer log and POS records add the operational detail needed to act on that information.
FAQs About Nightclub Event Inventory
When should a nightclub count stock for an event?
Count before service and again after close, before new stock changes the totals. This isolates the event’s movement so you can compare actual usage with sales and documented exceptions.
How should a nightclub set event-night par levels?
Use comparable event sales by station and SKU, then allow for expected demand and replenishment time. Review what ran short or remained untouched after the event and adjust the next plan.
Does Scannabar replace an event transfer log?
No. Scannabar supports inventory counts and usage analysis, while a documented transfer process supplies the context for bottles moved between storage and stations. Together they make variance easier to interpret.
What should managers investigate when inventory and POS sales disagree?
Check transfers, comps, breakage, partial-bottle measurements, and POS item mapping before deciding whether product was lost. Scannabar’s inventory reporting helps narrow the items that need review; the manager establishes the cause.
Your hotel's bar program probably generates strong top-line revenue. But if you have not looked closely at beverage cost control, a significant share of that revenue is walking out the door through variance: the gap between what your records say you should have and what you actually count on the shelf.
For a hotel bar doing $1 million in annual beverage sales, a 20% variance means $200,000 disappearing every year. Scannabar gives hotel operators the tools to close that gap, tracking every bottle from receiving to final pour.
Beverage variance hides inside busy nights, transfer slips nobody reconciles, and bottles that vanish between stockrooms. Left unchecked, it compounds week after week. This guide walks you through six practical steps to measure, reduce, and manage variance across your bars, banquet operations, and service outlets.
Quick Guide: How to Reduce Beverage Variance in 6 Easy Steps
Define how you will measure beverage variance: Pick one formula, apply it consistently, and make sure every outlet uses the same math.
Standardize recipes and pour sizes: Lock in exact ingredient amounts so that every drink carries a predictable cost.
Tighten receiving, transfers, and write-off logs: Record every bottle that enters, moves between outlets, or leaves your inventory.
Count high-risk inventory every week: Focus weekly counts on spirits, premium wines, and fast-moving products where losses concentrate.
Review variance by item, outlet, and shift: Break the data down so the number points you to a specific location, product, or time window.
Act on the cause, not just the number: Use Scannabar's variance reports to trace each discrepancy back to a correctable root cause.
How to Reduce Beverage Variance Across Your Hotel Bar Operations
1. Define how you will measure beverage variance
You cannot fix a problem you have not defined. Beverage variance is the difference between theoretical consumption (what your POS system says you sold, plus documented waste) and actual consumption (what a physical count reveals you used). Some properties express it as a percentage of cost, others as a dollar figure per period. Pick one and make sure every outlet uses the same formula.
Start by confirming that your POS rings are mapped to specific SKUs and portion sizes. If a "vodka soda" in the lobby bar rings up at 1.5 oz but the banquet team pours 2 oz for the same drink code, your variance is baked in before anyone even miscounts a bottle.
Agree on a reporting period. Weekly reporting catches problems while the responsible shift is still on the schedule. Monthly reporting buries causes under four weeks of compounding activity. A weekly inventory rhythm keeps the data actionable.
2. Standardize recipes and pour sizes
A recipe card is not a suggestion. It is the financial blueprint for every drink leaving your bar. For a deeper look at how drink recipes affect profitability, the math is straightforward. When recipes are vague or left to bartender discretion, pour cost swings from shift to shift, and that swing shows up directly as variance.
Document every cocktail, wine-by-the-glass portion, and draft beer yield. Include the exact quantity of each ingredient in ounces or milliliters, the expected number of servings per bottle, and the target cost per drink.
Post recipe cards at every station and train new hires on them during their first shift. Consider using jiggers or measured pourers for your highest-volume spirits. A standardized 1.5 oz pour on your top-ten spirits alone can move your pour cost by two to three percentage points.
3. Tighten receiving, transfers, and write-off logs
Variance often starts at the loading dock, not behind the bar. If a delivery arrives short and nobody catches it, your opening inventory is already wrong. Every bottle entering the property needs a verified receipt: someone checks the order against the invoice, counts the cases, and signs off.
Inter-outlet transfers are the next weak link. When the banquet team pulls two cases of vodka from the main bar for a Saturday event, that movement must be logged in writing or through your inventory system. Unlogged transfers make one outlet look short and another look over-stocked, making it impossible to isolate where variance originates.
Write-offs for breakage, spoilage, and complimentary pours require the same discipline. An unrecorded comp bottle is invisible shrinkage. A simple daily log with a reason code, the product, and a manager's initials is enough to keep these losses visible.
4. Count high-risk inventory every week
Full monthly inventories have their place, but they do not catch problems fast enough. By the time you discover a variance at month-end, the staff involved may have rotated off the schedule. The trail is cold.
Identify your top 20 highest-value and fastest-moving items. These typically represent 80% of your beverage cost. Count them every week. Scannabar measures the level in every open bottle using barcode scanning technology, so a single person can count 120 bottles in roughly 15 minutes. That speed makes weekly counts practical rather than aspirational.
Rotate a full count of your remaining inventory on a monthly cycle. This layered approach catches high-impact losses weekly while still covering your entire catalog periodically.
5. Review variance by item, outlet, and shift
A single, property-wide variance number is almost useless. If your hotel runs a lobby bar, a pool bar, a restaurant bar, and banquet service, a blended number hides where the problem lives.
Break variance down by individual product first. Is it concentrated in premium spirits, house-brand vodka, or draft beer? Then look at it by outlet. The pool bar might run tight while the banquet prep area runs loose.
Finally, compare variance by shift or by counting period. A spike that correlates with a specific team tells you where to focus your coaching.
This layered analysis turns a vague cost problem into a specific operational finding you can act on this week, not next quarter.
6. Act on the cause, not just the number
Variance is a symptom, not a diagnosis. A 12% variance on a premium tequila could mean over-pouring, unrecorded comps, a receiving error, or theft. The number alone does not tell you which one.
Cross-reference your variance data with POS sales, transfer logs, write-off records, and shift schedules. If usage exceeds sales and there are no documented transfers or write-offs, the gap is unexplained loss. If usage aligns with sales but both exceed what the recipes predict, you likely have a portioning problem.
Frame the conversation with your bar staff around accountability, not blame. When your team knows the system tracks every ounce, the goal is to help them prove they poured correctly, not to catch them in the act.
Scannabar's approach to cost reduction is built around that principle. That distinction is the difference between a culture of accountability and a climate of suspicion.
What Causes Beverage Variance in Hotel Bars?
Beverage variance in hotel bars traces back to five primary sources: over-pouring, unrecorded transfers between outlets, receiving errors, undocumented write-offs, and theft. Hotels face additional exposure because beverages move between multiple cost centers, including bars, restaurants, banquets, room service, and minibars. Managing wine inventory and spirits under a single system reduces the blind spots that create variance.
Over-pouring is the most common source. Without measured pours, bartenders tend to pour heavy, especially during high-volume shifts. According to FSM.How's guide to beverage control, average pour costs in hotel bars range from 18% to 24%, and even small deviations from standard pour sizes erode those margins fast.
The difference between a 1.5 oz pour and a 2 oz pour costs you roughly four to five missing servings per standard 750 ml bottle. That is money walking out the door on every pour.
Unrecorded transfers are uniquely problematic in hotels. A banquet manager who borrows six bottles of wine from the restaurant bar for a last-minute event may not log the transfer. That creates a phantom shortage in one outlet and a surplus in another. Neither figure reflects reality until someone reconciles them.
How Often Should a Hotel Review Beverage Variance?
Weekly variance reviews produce the fastest operational improvements. When you review variance every week, the data connects to recent shifts, specific staff, and identifiable events. You can ask your bar manager, "What happened with the Ketel One on Wednesday?" and get a meaningful answer.
Monthly reviews are too slow for high-risk items. By week four, the context around a mid-month spike is gone. However, a monthly review cycle works well for slower-moving products like specialty liqueurs, wines stored in the cellar, and dry goods.
The best approach layers both frequencies. Count and review your top 20 items weekly. Run a complete inventory and variance analysis monthly. Use the weekly data to coach staff and adjust operations in near-real time, and use the monthly data to evaluate trends, purchasing efficiency, and overall program health.
How Scannabar Helps You Reduce Beverage Variance
Scannabar provides the most precise bottle-level tracking available, following every container in your hotel from the moment it arrives to the moment it is fully depleted. The system uses barcode scanning and bottle-level measurement to record the exact contents of each container, eliminating the estimation and rounding errors that plague manual counts.
Because Scannabar integrates with your POS and property management systems, it automatically compares what you sold against what you used. The resulting variance reports break down discrepancies by product, outlet, and time period, so your food and beverage director can pinpoint exactly where losses occur.
Hotels running Scannabar routinely operate at 1%–3% shrinkage, down from the 20%–25% industry average. You can read more about lowering beverage costs in hotel environments.
The system measures 120 bottles in about 15 minutes, making weekly counts feasible even for properties with multiple bars and banquet outlets. That frequency is what turns data into action: a variance you find this week still belongs to a shift you can address.
Ready to close the gap between what you sell and what you pour? See how Scannabar works or call 1-800-939-8960 to talk to a person who has been doing this since 1998.
FAQs About Beverage Variance
What is a good beverage variance percentage for a hotel bar?
A well-controlled hotel bar should target variance below 3%. Many properties without systematic tracking run between 20% and 25%. Scannabar helps hotels close that gap by providing bottle-level measurement and automated variance reports that highlight discrepancies before they compound.
Can beverage variance be completely eliminated?
Zero variance is not a realistic goal. Small amounts of loss from evaporation, breakage, and legitimate complimentary pours are unavoidable. The objective is to document those acceptable losses and reduce unexplained variance to a minimum. With consistent weekly counting and standardized recipes, most hotels can hold unexplained variance below 2%.
How does over-pouring affect beverage variance?
Over-pouring is the largest single contributor to variance in most hotel bars. A bartender who pours 2 oz instead of a standard 1.5 oz gives away 33% more product on every drink. Across a busy weekend, that adds up to several bottles of unrecovered cost. Scannabar tracks pour-level usage so you can spot over-pouring patterns by product and by shift.
What role do inter-outlet transfers play in hotel beverage variance?
Transfers between bars, banquet areas, and restaurants are a frequent source of unexplained variance in hotels. When a transfer is not logged, one outlet shows a shortage and another shows a surplus. Neither number is accurate. A documented transfer process, supported by your inventory system, ensures that product movement is visible across every cost center.
How does Scannabar integrate with hotel POS systems?
Scannabar connects with your POS through CSV, XML, or a direct API built to your POS vendor's published specification. This integration allows the system to match sales data against physical counts automatically. The result is a variance report that compares what you rang in with what you actually used, broken down by outlet and product.
Most bar operators know shrinkage exists. Fewer know how much profit it drains every week, or how long their counting method delays the moment they catch it. For a bar generating $500,000 in annual beverage revenue, a shrinkage rate of 20% to 25% translates to $100,000 to $125,000 walking out the door every year.
This guide breaks down what purpose-built bar inventory software should do, where generic tools fall short for hotels and multi-location hospitality groups, and how to evaluate monthly costs against the real return: faster counts, earlier variance alerts, and tighter liquor control across every bar you operate.
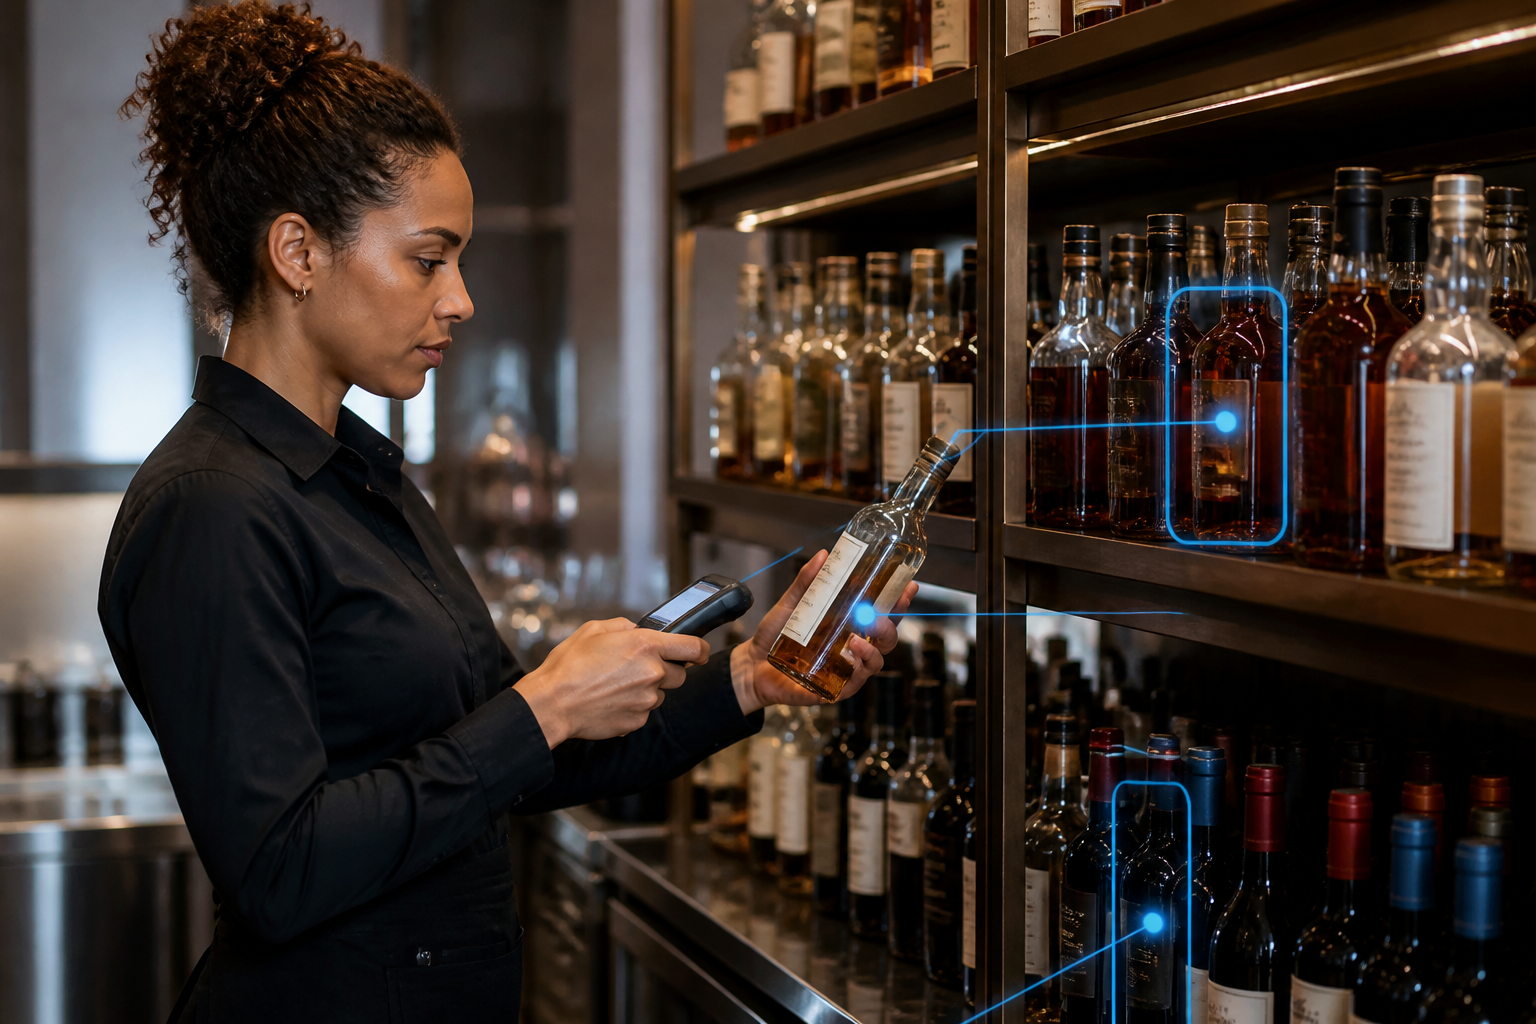
Serialized bottle tracking gives hotel and bar teams a faster way to count inventory and catch variance earlier.
Key Takeaways: Bar Inventory Software for Hotels and Hospitality Groups
Generic inventory tools miss bottle-level tracking, leaving variance undetected until thousands of dollars have already disappeared.
Serialized bottle tracking ties every ounce to a specific location, shift, and bartender for precise accountability.
POS integration closes the loop between what you sold and what you poured, exposing heavy pours and theft in real time.
Scannabar reduces shrinkage to 1% to 3% from industry averages near 25%, with clients reporting 25% to 50% beverage cost reductions.
Evaluating monthly software cost requires measuring labor savings, variance reduction, and faster decision-making alongside the subscription price.
Why Generic Inventory Tools Miss the Real Cost of Liquor Variance
Standard inventory platforms track quantities at the SKU level. They can tell you that you have 14 bottles of a particular bourbon on hand. They cannot tell you that three of those bottles are 60% depleted, one has been open for six weeks, and another has moved to the banquet prep area without a transfer record.
That gap matters because liquor variance hides in the details. A bottle that goes unaccounted for at a single-unit bar is a nuisance. A bottle that goes unaccounted for across 12 hotel bars, two banquet stations, and a rooftop lounge is a systemic blind spot that compounds every week you fail to catch it.
How Slow Counts Delay Variance Detection
Counting by hand is still the default at most bars. The math is brutal. A well-stocked bar carrying 80 to 120 open bottles takes 45 minutes to an hour to count by hand. Multiply that across multiple bars in a hotel property, and you are looking at a full shift dedicated to counting rather than serving.
The bigger problem is frequency. When counting takes that long, operators push it to once a month or once a quarter. That delay means variance builds silently. heavy pours, spillage, theft, and breakage accumulate for weeks before anyone sees the numbers.
By the time a monthly count reveals a $4,000 discrepancy, the damage is done. You have no way to trace which shift, which bartender, or which bar station contributed to the loss. The money is gone. The behavior that caused it has been repeating unchecked for 30 days.
Why Bars, Hotels, and Multi-Location Groups Need Different Controls
A standalone neighborhood bar and a 300-room hotel with four beverage outlets have fundamentally different control requirements. The bar owner needs speed and accuracy for a single location. The hotel F&B director needs centralized visibility across bars, banquet stations, minibars, and poolside service points, each with different par levels, different product mixes, and different staff rotations.
Multi-location hospitality groups add another layer. They need standardized processes across properties so that variance data is comparable, purchasing is aggregated, and a new bar manager in Miami follows the same counting protocol as the veteran in Nashville. Generic tools rarely offer that kind of operational standardization.
Bars, hotels, and multi-location groups need different inventory controls, but they all need accurate variance visibility.
What Bar Inventory Software Should Include
Not every platform calling itself bar inventory management software delivers the controls that hospitality operators need. The features below separate purpose-built hospitality tools from adapted warehouse or retail inventory systems.
What Serialized Bottle-Level Tracking Changes
Serialized tracking assigns a unique identity to every bottle the moment it enters your building. This approach is what makes liquor inventory precise at the bottle level.
When that bottle is scanned during receiving, the software creates a profile containing brand, volume, cost, and dimensional data. From that point forward, every measurement and every transfer is logged against that specific bottle.
If a bottle disappears from a service well between Tuesday's close and Wednesday's open, the system flags exactly which bottle is missing and where it was last recorded. That specificity separates precise liquor control from general-purpose inventory management.
Scannabar builds its entire system around this principle. Each bottle receives a bar-coded tracking label at receiving, and the software monitors its contents from the first pour to the final drop. The result is perpetual inventory that tracks every ounce, not just every case.
Why POS Integration Matters for Liquor Control
Inventory data without sales data is only half the picture. You know what you had and what you have now, but you do not know what should have been consumed based on actual register activity.
POS integration closes that gap. The software compares theoretical consumption (what your recipes say you should have poured) against actual consumption (what the count shows). The difference is your variance, and it points you exactly where to look.
A bar running 5% variance on well vodka might seem acceptable until you calculate the dollars. On a product moving 15 bottles a week at $18 per bottle, that variance costs roughly $700 a year on one SKU. Multiply across your full product line and the total adds up fast.
Scannabar integrates with POS platforms including Aloha, Micros, and InfoGenesis, creating a closed-loop system where counts, sales, and variance reports feed from the same data source.
POS integration helps operators compare sales data with actual usage so variance shows up faster.
How Barcode and Bottle-Based Counts Reduce Labor
Speed is not a luxury when you are managing inventory across multiple bars. Barcode scanning eliminates the clipboard-and-calculator process that eats hours every count cycle. Instead of reading labels, estimating fill levels, and writing numbers on a spreadsheet, your staff scans each bottle and lets the software calculate contents automatically.
Scannabar's system measures the contents of 120 bottles in roughly 15 minutes. A property running four bars can complete a full-property count during a single shift, which means you can count daily or after every shift without pulling staff away from revenue-generating work.
That frequency changes everything. Daily counts catch variance within 24 hours instead of 30 days. Weekly counts give you trend data that exposes patterns such as a particular bartender consistently running higher variance on premium spirits during Friday night shifts.
How Scannabar Fits Hospitality Operations
Scannabar was built for hospitality operators. It was not adapted from a warehouse platform or bolted onto a POS system as an afterthought. The system serves bars, restaurants, hotels, nightclubs, golf and country clubs, and cruise ships across the U.S. and Canada.
How Scannabar Supports Bar Operators
For independent bar owners and managers, Scannabar delivers bottle-level tracking without the overhead of enterprise software. The hand-held scanning unit is simple enough that any staff member can perform a count after minimal training.
The system flags missing bottles, calculates variance, and generates reports that show you exactly where your dollars are going. You can read more about how inventory tracking improves profitability across bar operations.
The practical result is a culture of accountability that protects both your profits and your staff. When bartenders know that every bottle is individually tracked, heavy pours and unrecorded drinks decline without you needing to stand behind the bar watching every pour. Staff members are protected from false accusations because the data is precise and defensible.
How Scannabar Supports Hotel Beverage Teams
Hotels present unique inventory challenges. A single property may operate a lobby bar, a rooftop lounge, a pool bar, a restaurant bar, and multiple banquet and event stations. Product moves between these locations constantly, and each outlet may carry a different product mix with different par levels.
Scannabar handles multi-outlet properties with a single system. Inventory transfers between bars are tracked on the portable hand-held device, so the F&B director always knows which bottles are at which location. The system works at fixed bars, portable bars, and outdoor event stations, giving hotel teams centralized visibility from one process.
Properties operating under brands like Ritz Carlton, Hyatt, Sheraton, and Intercontinental already rely on Scannabar for this kind of hotel-wide liquor control.
How Scannabar Supports Multi-Location Groups
Hospitality groups managing multiple properties need two things generic tools rarely deliver: standardized counting processes and cross-location performance comparison. If every location counts differently, your variance data is not comparable and your purchasing decisions are based on inconsistent information.
Scannabar standardizes the entire process. Every location uses the same scanning hardware, the same software, and the same measurement methodology. That means a 3% shrinkage reading at your Nashville property and a 7% reading at your Miami property are directly comparable, and you can investigate the difference immediately.
Aggregated purchasing data across locations also strengthens your position at the distributor table. When you can show a supplier exact consumption volumes across 10 or 20 properties, you are negotiating from hard numbers, not estimates.
How to Compare Monthly Software Costs the Right Way
Price comparison is where most buyers go wrong first. They line up monthly subscription fees on a spreadsheet and pick the lowest number. That approach ignores the biggest cost of all: what each platform fails to catch.
What to Measure Beyond Subscription Price
Start with labor. How many hours does your team currently spend counting inventory each month? Multiply those hours by your loaded labor rate. If a platform cuts counting time by 75%, that labor savings alone may cover the subscription several times over.
Next, measure variance detection speed. A system that catches a $200-per-week loss in the first week saves you $800 compared to a system that catches it at the end of the month. Over a year, faster detection on just a handful of products can represent thousands of dollars.
Then look at integration costs. Some platforms charge separately for POS integration, for additional locations, or for report customization. Scannabar includes software support and upgrades at no additional charge, with no yearly or monthly licensing fees beyond the initial system cost. That pricing structure eliminates the hidden costs that inflate the total expense of subscription-based alternatives.
How Faster Counts and Earlier Alerts Affect ROI
If your current counting method takes 8 hours per month across all locations and a barcode-based system reduces that to 2 hours, you recover 6 hours of labor every month. At $25 per hour loaded, that is $150 in direct monthly savings.
Many Scannabar clients report reducing shrinkage to 1% to 3% from previous levels near 25%. For a bar doing $500,000 in annual beverage sales, dropping from 25% to 3% recovers $110,000 per year. A more conservative improvement to 10% still recovers $75,000.
The ROI timeline for most operators is weeks, not months. According to the National Restaurant Association's 2025 cost analysis, keeping beverage cost ratios in check remains a top priority across the industry.
Scannabar clients generally see a 25% to 50% reduction in beverage costs within the first few weeks. That rapid payback should anchor your cost comparison, not the subscription line item.
What Questions to Ask Before Choosing a Bar Inventory Platform
Before signing a contract, put each vendor through questions that reveal whether their platform was built for hospitality or adapted from another industry.
Does the System Track Individual Bottles or Only SKU Quantities?
SKU-level tracking tells you totals. Bottle-level tracking tells you where every ounce went. If you need to identify a missing bottle at a specific bar station, only serialized tracking delivers that answer.
How Does the System Measure Partial Bottles?
Estimating fill levels by eye introduces the same human error you are trying to eliminate. Look for calibrated measurement tools, whether that is a bar-coded ruler, a scale, or another precision method.
What POS Systems Does the Platform Integrate With?
Confirm that your current POS is supported natively. A third-party middleware layer adds cost, extra configuration, and potential points of failure.
Can the System Handle Multi-Location Operations?
Ask how variance data is standardized across properties. Can you compare shrinkage rates between locations using the same methodology? Can you aggregate purchasing data for distributor negotiations?
What Is the Total Cost of Ownership?
Ask about licensing fees, per-location charges, integration fees, and upgrade pricing. Some platforms advertise low subscriptions but add charges for features that should be standard. Scannabar includes support, upgrades, and toll-free customer service 7 days a week at no extra charge.
How Quickly Can Staff Learn the System?
A system that requires days of training slows your rollout and increases labor costs. Scannabar's hand-held device is simple enough that staff can begin performing counts within a single shift.
In Conclusion: How to Choose Bar Inventory Software That Protects Your Margins
The real cost of bar inventory is not the software subscription. It is the money you lose every week that your current system fails to detect. Variance, heavy pours, missing bottles, and delayed counts create a cascade of hidden costs that compound across every bar and every location you operate.
Purpose-built bar inventory software with serialized bottle tracking, POS integration, and barcode-based counts closes the gap between what you think you are losing and what you are actually losing.
Scannabar delivers that level of control for independent bars, hotel properties, and multi-location groups. The track record speaks for itself: shrinkage reduced to 1% to 3%, beverage costs cut by 25% to 50% within weeks of implementation.
The question is not whether you can afford to invest in better liquor control. It is whether you can afford to keep making decisions with delayed inventory data.
FAQs About Bar Inventory Software
What is bar inventory software and why do hospitality operators need it?
Bar inventory software automates the process of counting, tracking, and analyzing your beverage stock. It replaces hand counts with barcode scanning and digital measurement, giving you accurate data on what you have, what you sold, and what went missing. Scannabar tracks every bottle individually from receiving to depletion, so operators catch variance within hours instead of weeks.
How does POS integration improve liquor inventory control?
POS integration compares what your register says you sold against what your physical inventory shows you actually poured. The difference is your variance, and it points directly to heavy pours, theft, or waste. Scannabar connects with POS platforms like Aloha, Micros, and InfoGenesis to create a closed-loop system that flags discrepancies automatically.
Can bar inventory software work across multiple hotel bars and banquet stations?
Yes. Purpose-built hospitality inventory systems handle multi-outlet properties by tracking bottles across fixed bars, portable bars, and event stations. Scannabar manages transfers between locations on a portable hand-held device, giving F&B directors centralized visibility into every outlet from one system.
How long does a full bar inventory count take with scanning technology?
With barcode-based scanning, a bar stocked with 80 to 120 bottles takes roughly 15 minutes to count. That speed allows operators to count after every shift or daily, catching variance far earlier than monthly hand-counts. Scannabar processes all calculations automatically during the scan, so reports are ready the moment you finish.
What should I look for when comparing bar inventory software pricing?
Look beyond the monthly subscription. Factor in labor savings from faster counts, revenue recovered through earlier variance detection, and hidden costs such as per-location charges, integration fees, and support contracts. Scannabar includes toll-free support, software upgrades, and ongoing service at no additional charge, with no recurring monthly or yearly licensing fees.
How does serialized bottle tracking differ from standard SKU-level inventory?
SKU-level tracking tells you how many bottles of a product you have on hand. Serialized tracking assigns a unique identity to each individual bottle and monitors its contents through every scan. Scannabar's serialized approach means you know exactly which bottle is missing and exactly where it was last recorded, giving you accountability at the individual bottle level.
Barcode liquor inventory for hotel bars matters because beverage profit disappears fast when your team cannot see exactly what was received, transferred, poured, and left on the shelf. For a hotel bar generating $800,000 in annual beverage sales, a 20% shrinkage rate can mean $160,000 slipping out of the business through waste, theft, and count errors.
Barcode liquor inventory gives you a way to measure what older counting methods miss. Instead of relying on clipboard notes and delayed reconciliations, your team records bottle-level movement with Barcode Scanning Technology and turns those scans into Real-Time Data your managers can use the same day.
In this guide, you will see how barcode liquor inventory works in hotel bars, why it improves Accuracy and Accountability, and how Scannabar helps hospitality teams tighten beverage control in 2026.
Key Takeaways: Barcode Liquor Inventory for Hotel Bars
Hotel bars lose 20% to 25% of liquor profits to shrinkage when inventory relies on estimation instead of measurement.
Barcode scanning tracks every bottle individually, creating a verifiable audit trail from delivery through depletion.
Automated inventory counts cut counting time dramatically, freeing staff to focus on guest service and revenue.
Real-time variance reports expose over-pouring, theft, and ordering gaps before they compound into larger losses.
Scannabar gives hotel operators precise bottle-level tracking and actionable reporting built specifically for hospitality operations.
Why Hotel Bars Need Better Liquor Inventory Control in 2026
Where Hotel Beverage Programs Lose Money
Shrinkage in a hotel bar hits from multiple directions at once: over-pouring, spillage, miscounted transfers between storage and service areas, and outright theft. A hotel property often runs several outlets, from the lobby lounge to banquet stations. Each outlet introduces another layer of product movement that older counting methods struggle to capture.
The financial damage adds up fast. For a hotel generating $500,000 in annual beverage sales, a 25% shrinkage rate means $125,000 in lost product and unrealized revenue. Yet many properties still write it off as an unavoidable cost of doing business.
According to a CBRE Hotels Research report published in October 2025, beverage revenues at hotel banquets declined by 2.0% year-over-year, even as food revenues grew. When revenue is flat, every percentage point of shrinkage hurts more. Tighter inventory controls protect margins that pricing increases alone cannot recover.
Why Hotel Operations Make Inventory Harder
Hotels face inventory complications that most standalone restaurants never encounter. Staff rotate across shifts and departments. Product moves between locked storage rooms, satellite bars, banquet staging areas, and sometimes off-site event locations. A single bottle of premium vodka might pass through three sets of hands before it reaches the guest.
Seasonal occupancy swings create another problem. A resort property may double its beverage volume during peak season and cut it in half during the off-months. Par levels set for one period rarely hold for the next, and manual recalculations introduce errors that cascade through purchasing, storage, and financial reporting.
High staff turnover compounds both issues. When new bartenders or barbacks join mid-season, they inherit processes that may never have been documented. Without a system that enforces consistency, every personnel change introduces fresh opportunities for counting mistakes and accountability gaps.
How Barcode Liquor Inventory Works in a Hotel Bar
What Gets Tracked at the Bottle Level
A barcode-based liquor inventory system assigns a unique tracking label to each bottle when it arrives at your receiving dock. Staff scan that label along with the bottle's UPC code, and the software creates a profile containing brand, volume, dimensions, and cost. Every subsequent scan updates the bottle's status in real time.
Content measurement separates barcode inventory from simple item tracking. A calibrated, bar-coded ruler placed against a bottle determines how much liquid remains, measured to the ounce. You know not just that a bottle of bourbon is "open" but that it holds 14.2 ounces at the end of a Tuesday night shift.
This bottle-level data feeds into a perpetual inventory record that reflects current stock across every outlet, storage room, and banquet station in the hotel. You no longer have to wait until month-end to discover that three bottles of premium tequila went unaccounted for during a weekend event.
How Barcode Data Improves Accountability
When every bottle carries a unique identifier and every scan generates a time-stamped record, your team operates inside a closed-loop system. If a bottle goes missing between the storeroom and the pool bar, the data shows when it was last scanned, where it was, and who handled the transfer.
That level of visibility changes behavior. Bartenders and barbacks who know that each pour is measurable and each bottle is traceable tend to follow standardized recipes more consistently. The point is not surveillance. The system builds a culture of accountability where accurate pours become the default, not the exception.
Accountability also protects honest staff. When inventory discrepancies arise, managers can investigate using objective data rather than suspicion. An employee who consistently records accurate counts and handles transfers by the book has a verifiable record that speaks for itself.
What Hotel Operators Gain from Barcode Scanning
Faster Automated Inventory Counts With Better Accuracy
Traditional hotel bar counts consume hours of management time. A bar manager counting 200 bottles by hand might spend three to four hours on a single outlet. Multiply that across a lobby bar, a rooftop lounge, a pool bar, and two banquet stations, and you have burned an entire shift on a task that still produces rough estimates.
Barcode scanning collapses that timeline. With a handheld scanner, a trained staff member can measure the contents of approximately 120 bottles in about 15 minutes. The software processes each scan instantly, updating inventory values and flagging anomalies without requiring a separate data-entry step.
Speed matters. Accuracy is where the real payoff lands. Eliminating visual estimation removes the 1% to 3% error margin that plagues hand counts. For a hotel with $1,000,000 in annual beverage purchases, that margin of error represents $10,000 to $30,000 in inventory inaccuracies every year.
Better Purchasing and Par-Level Decisions
Accurate, up-to-date inventory data transforms purchasing from a blind guess into a structured process. When your system shows real-time stock levels across every outlet, you can set par levels that reflect actual consumption patterns rather than gut estimates from last quarter.
That precision prevents two costly mistakes at once. Over-ordering ties up capital in bottles that sit on shelves, age past their prime, and occupy storage space you cannot afford to waste. Under-ordering leads to stockouts that disappoint guests and push bartenders toward off-menu substitutions that throw off your pour cost targets.
Automated reorder alerts add another layer of protection. When stock on a high-velocity SKU drops below its par level, the system flags it before you run dry. Over time, aggregated purchasing data also gives your F&B director the numbers to negotiate volume pricing with distributors.
How Scannabar Supports Hotel Bar Inventory Management
Barcode Scanning Technology Built for Hospitality
Scannabar was built from the ground up for bars, hotels, nightclubs, and restaurants. The system uses wireless, handheld scanners paired with proprietary software that tracks every ounce of wine, liquor, and beer across your entire property. Whether you operate two outlets or twenty, one Scannabar system handles them all.
Setup is straightforward. When a bottle arrives, your team applies a small bar-coded tracking label, scans it alongside the bottle's UPC code, and the software builds a complete profile. From that point on, each scan with the calibrated bar-coded ruler records the exact liquid level in every container, updating your central inventory in real time.
Scannabar's clients include properties operating under banners like Ritz Carlton, Hyatt, and Sheraton. The system scales to handle multi-outlet hotel operations without requiring specialized IT staff. Teams are typically operational within a single shift.
Reporting That Helps Teams Act Faster
Data sitting in a spreadsheet nobody opens is worthless. Your team needs numbers they can read and respond to the same day. Scannabar generates variance reports, usage summaries, and cost-of-goods analyses that translate raw scan data into actionable numbers.
When a variance report shows that your rooftop bar consumed 18% more vodka than POS sales justify, your bar manager knows exactly where to look and what questions to ask.
Scannabar clients have reported reducing shrinkage to 1% to 3%, down from the 20% to 25% they experienced before implementation. Operators generally see a 25% to 50% reduction in beverage costs within weeks. Those are reported outcomes, not projections.
Reporting also supports the broader F&B strategy. When you can see which spirits move fastest and which outlets generate the most waste, your purchasing and staffing decisions improve. Scannabar turns bottle-level scans into property-level intelligence.
In Conclusion: How Hotel Bars Can Modernize Inventory in 2026
Hotel bars that still count by hand in 2026 are choosing to accept shrinkage, error, and inefficiency that barcode technology has already solved. The math is plain: 20% to 25% of your liquor revenue disappearing into untracked pours, miscounted transfers, and undocumented losses is not a cost of doing business. It is a problem with a fix.
Barcode-based inventory gives your team the speed, accuracy, and accountability that older methods cannot deliver. Scannabar provides that capability in a system built specifically for hospitality operators, backed by reported outcomes that include shrinkage reductions to as low as 1% and beverage cost savings of 25% to 50%.
If your hotel still relies on delayed counts and partial visibility, now is the time to tighten beverage control. Scannabar gives you Barcode Scanning Technology, Real-Time Visibility, and Actionable Insights that help your team count faster, investigate variances sooner, and protect margin across every outlet.
The business case is already there. The next step is putting a better system in place and using it consistently.
FAQs About Barcode Liquor Inventory for Hotel Bars
What is barcode liquor inventory and how does it work in a hotel bar?
Barcode liquor inventory uses a unique label on each bottle so a handheld scanner can record its identity and liquid level with every count. The Scannabar system pairs that label with a calibrated bar-coded ruler to measure contents to the ounce, giving hotel bars real-time visibility into every bottle across every outlet.
How does barcode scanning reduce hotel beverage shrinkage?
Every scan creates a time-stamped, bottle-specific record that links product movement to individual staff members and locations. Scannabar clients have reported shrinkage dropping to 1% to 3%, down from the 20% to 25% range common at properties relying on manual processes.
Can a barcode inventory system handle multiple hotel bar outlets?
Yes. A single Scannabar system tracks inventory across lobby bars, pool bars, rooftop lounges, banquet stations, and storage rooms simultaneously. Each outlet maintains its own stock profile while feeding data into one centralized dashboard for property-wide reporting.
How long does a barcode inventory count take compared to a manual count?
A trained staff member can scan and measure approximately 120 bottles in about 15 minutes using Scannabar. A manual count of the same number of bottles, with visual fill-level estimates, typically takes three to four hours and produces far less accurate results.
Does barcode inventory integrate with hotel POS and property management systems?
Scannabar integrates with point-of-sale systems and property management platforms, enabling closed-loop tracking that compares what was sold to what was actually consumed. That integration helps F&B directors pinpoint variances that would otherwise go undetected between manual count cycles.
What kind of reporting does a barcode liquor inventory system provide?
Scannabar generates variance reports, usage summaries, and cost-of-goods analyses that break down performance by outlet, product category, or individual SKU. These reports help hotel teams identify over-pouring patterns, flag missing bottles, and make purchasing decisions based on measured data rather than estimates.