Liquor Inventory Experts

Bar Waste Logs: Track Spillage, Spoilage, and Breakage

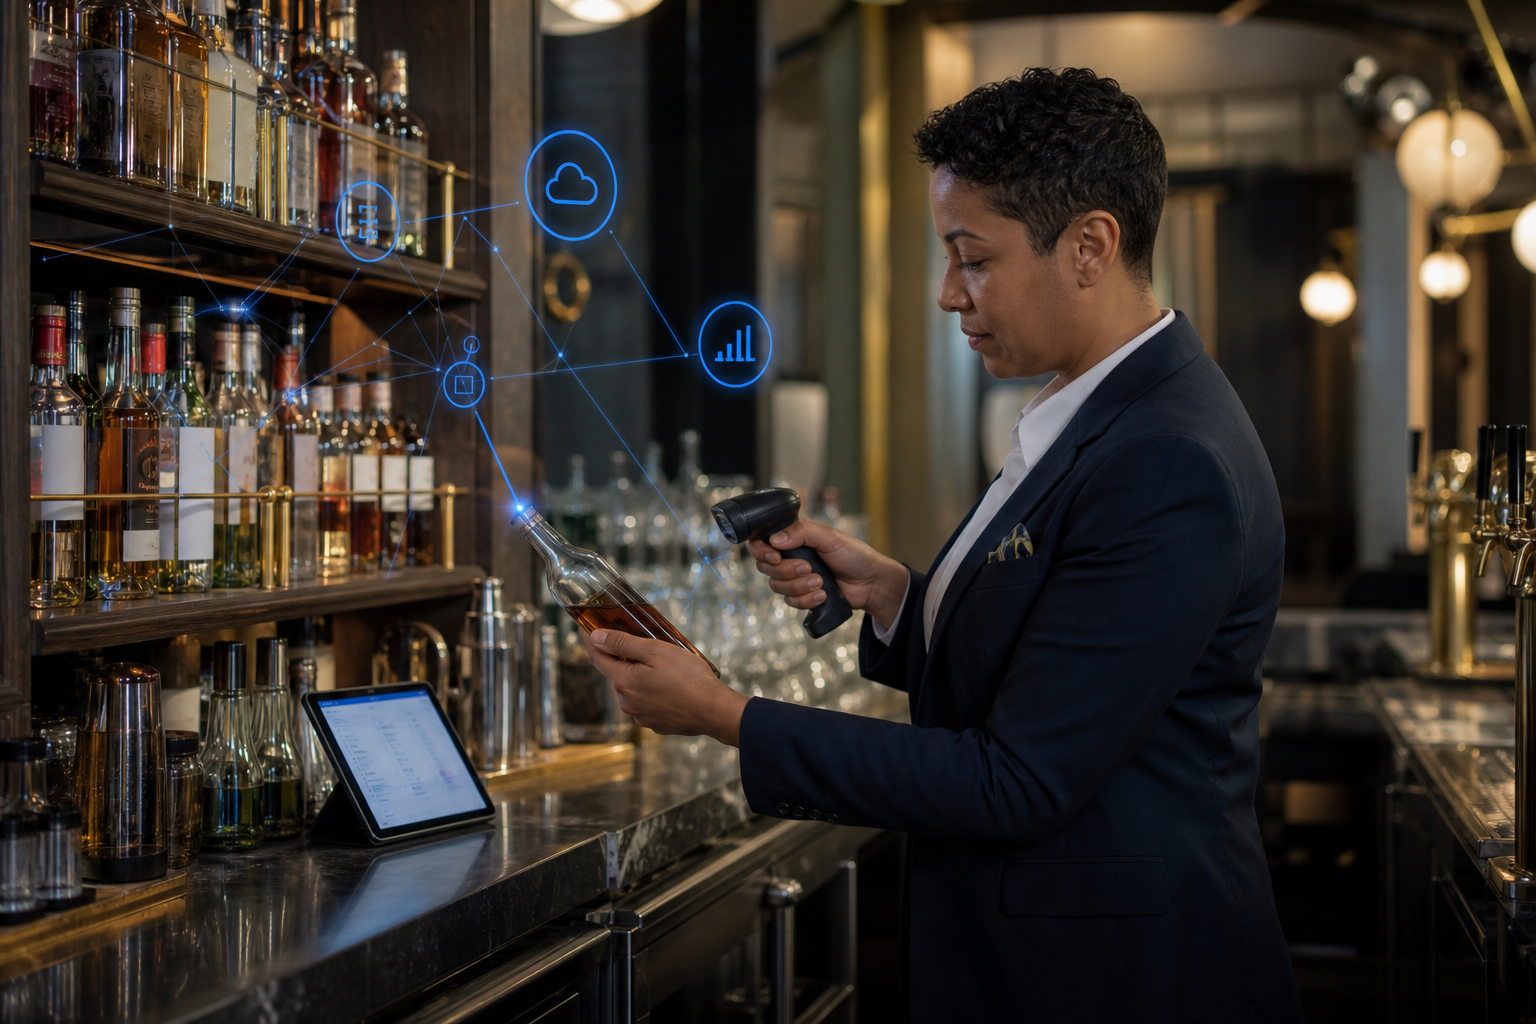
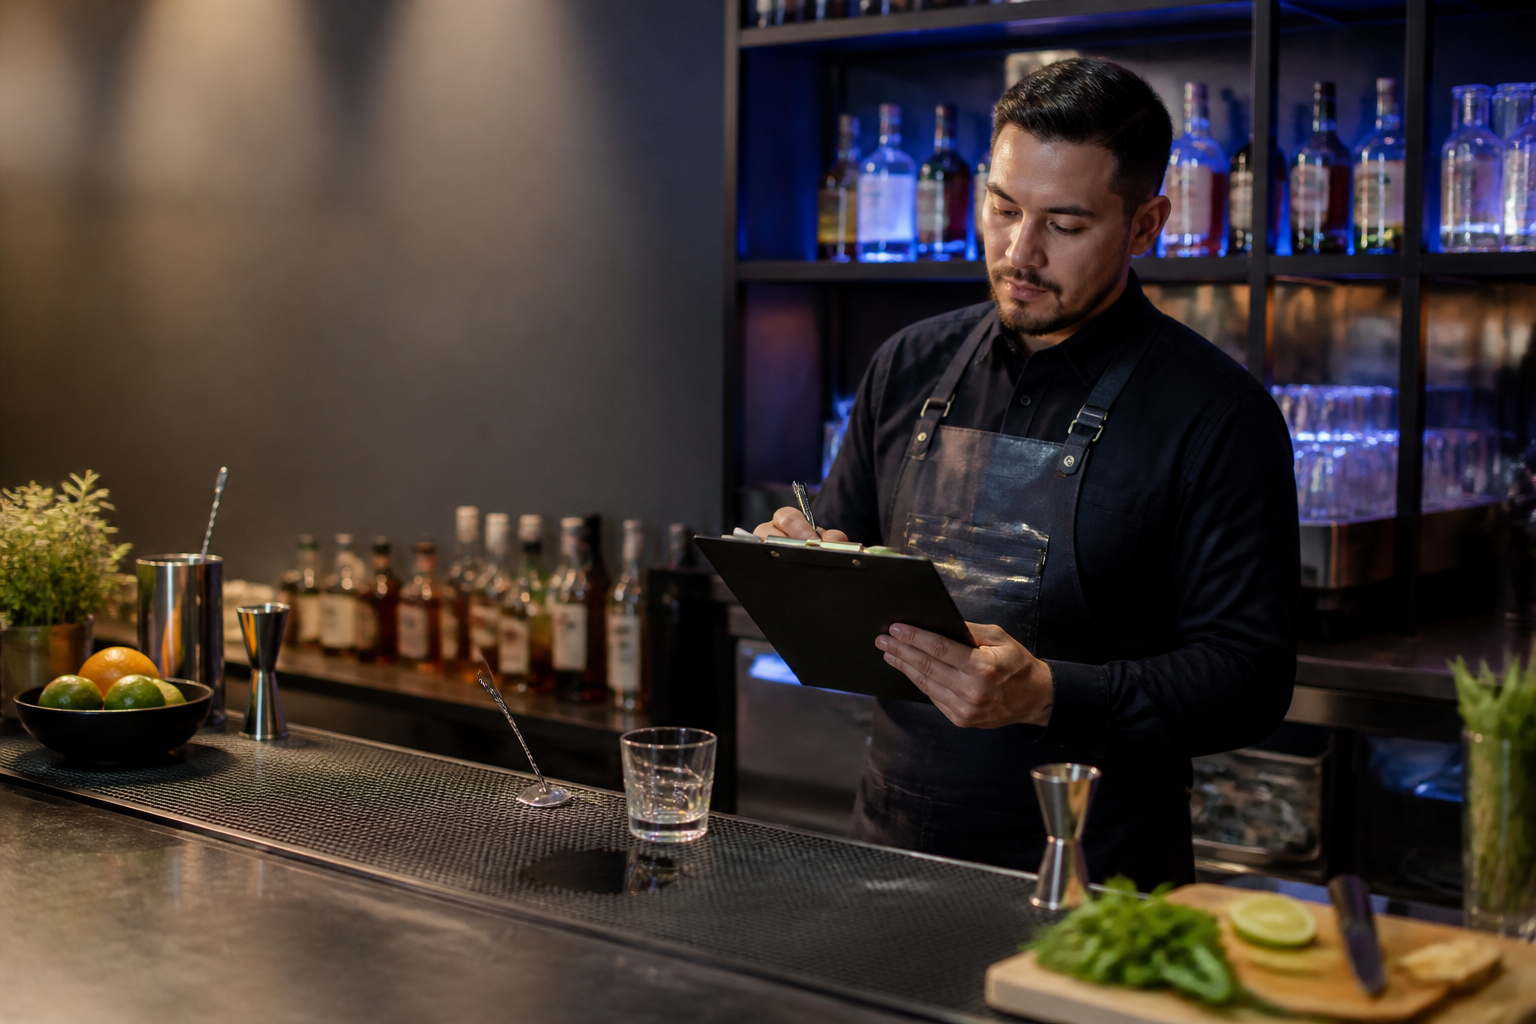
Professional bartender recording a waste log entry at the bar station

The average bar loses 20% to 25% of its beverage inventory to shrinkage, and a significant portion of that loss is legitimate waste: spills during service, bottles that break in storage, kegs that foam out, and product that expires before it can be sold. According to the National Restaurant Association, for every dollar invested in food-waste reduction, restaurants can realize approximately $8 in cost savings. The same principle applies to beverage waste. The problem is not that waste happens. The problem is that unrecorded waste inflates your unexplained variance and makes it impossible to separate ordinary operational loss from theft or over-pouring.

This guide covers the difference between recorded waste and unexplained variance, the fields your waste tracking log needs, how to calculate cost patterns, and how to build staff accountability without creating a blame culture. The examples use hypothetical numbers. Apply your own data before changing procedures.

Key Takeaways: Bar Waste Logs

  • Recorded waste and unexplained variance are two distinct categories: separating them is the foundation of honest inventory management.
  • A useful waste log captures product, quantity, reason, shift, employee, and date for every event.
  • Calculate waste cost patterns by item, shift, and reason code to identify where corrective action will produce the largest savings.
  • Scannabar supports the bottle-level inventory measurement that connects your waste log to accurate variance analysis.
  • Staff accountability works when records protect honest employees from false accusations rather than assigning blame by default.

What Is the Difference Between Recorded Waste and Unexplained Variance?

Recorded waste is product that left your inventory through a documented, legitimate event: a spill, a broken bottle, a spoiled garnish, a drink that was remade for quality reasons, or a complimentary pour approved by a manager. Each of these events is expected in a busy bar. Each one costs money. And each one should be logged the moment it happens.

Unexplained variance is the gap that remains after you account for sales, documented waste, transfers, and returns. It is the difference between what your theoretical usage says you should have consumed and what your physical counts show you actually consumed, minus everything you can explain.

Why the Distinction Matters for Cost Control

When waste goes unrecorded, it gets lumped into unexplained variance. That inflated number triggers one of two responses: either management ignores it because the variance seems too large to investigate, or management assumes the entire gap is theft and creates a hostile environment that damages morale.

Neither response helps. The first lets real losses continue. The second punishes honest staff for a number they did not cause. A disciplined waste log separates what you can explain from what you need to investigate, giving you a realistic target for improvement.

For a bar doing $400,000 in annual beverage sales, a 4% total variance represents $16,000. If half of that variance is documented waste from spills and breakage, your unexplained gap is $8,000. That is a specific, manageable target. Without the waste log, you are staring at $16,000 and guessing where it went.

What Fields Does a Reusable Waste Log Need?

A waste log is only useful if it captures enough context to make the event actionable. A line that reads "1 bottle broken" tells you almost nothing. A line that reads "1 bottle Absolut Vodka 750 mL, breakage, dropped during restock, Friday PM shift, Employee: J. Torres, 2026-01-17" tells you the cost, the cause, the pattern potential, and the person who can explain what happened.

Essential Fields

Your log should include the following fields for every waste event:

FieldWhat It CapturesWhy It Matters
ProductBrand name, bottle size, SKUEnables dollar-cost calculation and links the event to your inventory system
QuantityUnits lost (ounces, bottles, servings)Converts the event into a measurable cost for variance reconciliation
Reason CodeSpill, breakage, spoilage, comp, remake, batch lossSeparates waste causes so corrective action targets the right category
EmployeeName or ID of person involvedSurfaces handling patterns for coaching, not for automatic blame
ShiftDay part (AM, PM, late night)Ties waste events to staffing levels, service pace, and operational conditions
Date and TimeWhen the event occurredAligns the waste event with the count window and POS sales period

Filled Example: A Friday Night Waste Log

The following entries are hypothetical and demonstrate how a completed log looks in practice. The product costs are illustrative.

DateShiftEmployeeProductQtyReasonEst. Cost
2026-01-17PMJ. TorresAbsolut Vodka 750 mL1 bottleBreakage$18.00
2026-01-17PMM. ChenHouse Margarita mix12 ozSpill$1.80
2026-01-17PMK. AdamsHendrick's Gin 1 L2 ozRemake$2.40
2026-01-17LateR. DiazDraft IPA keg32 ozFoam/line issue$4.80
2026-01-17PMJ. TorresLime wedges (prepped)~20 piecesSpoilage$1.50
2026-01-17LateM. ChenMaker's Mark 750 mL1.5 ozComp (mgr approved)$2.10

Total documented waste for the night: $30.60. Each entry ties to a person, a shift, a reason, and a cost. These entries explain $30.60 of your period variance. Without them, $30.60 of legitimate loss would sit in your unexplained column.

How to Calculate Waste Cost Patterns

Individual waste events are small. Their patterns are not. A single $18 broken bottle is an annoyance. Six broken bottles per month across the same restock procedure is a $108 recurring cost that points to a process problem.

Summarize by Item

At the end of each reporting period, total your waste cost by product. Sort the results from highest cost to lowest. The top five products by waste cost are your priority targets for corrective action.

If your house vodka appears at the top of the list every period, investigate the specific causes. Is it breakage during delivery? Spills from a poorly positioned speed rail? Over-pouring that staff are logging as spills? The reason codes in your log separate these causes so your response matches the real problem.

Summarize by Shift

Compare waste totals across shifts. If late-night shifts consistently produce more waste than afternoon shifts, the cause may be staffing levels, fatigue, service pace, or the types of drinks being served. A busy late-night shift pouring more cocktails will naturally produce more spills than a quiet Tuesday afternoon pouring wine.

Normalize the comparison by dividing waste cost by total drinks served per shift. A $40 waste total on a 600-drink shift is a different story than $40 on a 150-drink shift.

Summarize by Reason Code

Reason code analysis reveals whether your waste is dominated by one category. If breakage accounts for 60% of your total waste cost, your storage, restocking, and handling procedures need review. If spoilage dominates, your purchasing quantities or prep batch sizes are too large for your actual demand.

The following hypothetical monthly summary shows how reason codes distribute waste cost for a mid-volume bar:

Reason CodeMonthly CostShare of TotalCorrective Action
Spillage$14538%Review speed rail placement, portion standards
Breakage$9224%Audit restock procedure, storage conditions
Spoilage$6818%Reduce perishable batch sizes, enforce rotation
Comps (approved)$4813%Review comp policy, track approval frequency
Remake/batch loss$277%Check recipe clarity, staff training on builds

Total monthly waste: $380. That figure now has a structure. You know where to focus. Spillage at $145 per month is $1,740 per year. If improved rail placement and portion training reduce spillage by 30%, you recover $522 annually from one corrective action.

How to Build Staff Accountability Without Blame

A waste log that records employee names creates anxiety if the culture treats every logged event as a mark against the person. That anxiety produces the worst possible outcome: staff stop logging waste to avoid being associated with loss, and your unexplained variance climbs right back up.

Frame the Log as Protection, Not Punishment

When you introduce the waste log, explain its purpose to your team clearly. Recorded waste is expected. Every bar produces spills, breaks bottles, and discards product. The log exists to explain those losses so that honest staff are not blamed for a variance number they did not cause.

This framing aligns with how operators should use inventory accountability in general. The goal is a culture of accountability where records protect everyone, not a surveillance system where every logged event becomes a disciplinary action.

Separate Training Conversations From Disciplinary Actions

If one employee's waste log shows a pattern of broken bottles during restock, the first response is a training conversation, not a write-up. Walk through the restocking procedure together. Observe their technique. Identify whether the problem is a skills gap, a workflow design issue, or an equipment problem.

Disciplinary action belongs in a different process and should be triggered by evidence of misconduct, not by normal operational waste. If you punish staff for logging a $2 spill, they will stop logging spills. Then your data goes dark, and your ability to manage waste disappears with it.

Share Aggregate Results With the Team

Post monthly waste summaries where your team can see them, without attaching individual names. Show the total cost, the top reason codes, and the trend over time. Celebrate reductions. Discuss increases. Keep the conversation about process improvement rather than individual performance.

When the team sees that recorded waste is going down and management is responding with process changes rather than punishment, compliance with the logging procedure increases. That compliance improves your data quality, which improves your variance analysis, which gives you better targets for cost reduction. The cycle reinforces itself.

How to Implement a Waste Log Without Slowing Down Service

The most common objection to waste logging is that it takes too long during a busy shift. If your bartender has to leave the service well, find a clipboard, write three lines of detail, and return to the queue, the log will be abandoned by the end of the first Friday night. The format and placement of the log must match the pace of your operation.

Keep the log at the bar station, not in a back office. A single sheet clipped to the speed rail or a tablet mounted at eye level takes under 20 seconds to complete per entry. Pre-populate the product list with your top 30 SKUs so the person logging can circle or tap rather than write from scratch. Reason codes should use a short dropdown: spill, break, spoil, comp, remake.

For high-volume bars, consider logging waste at natural pause points: between ticket batches, during a brief lull, or at handoff between bartenders. The accuracy of a 15-second log entered within a minute of the event is far higher than a memory-based entry at end of shift.

How the Waste Log Connects to Inventory Variance Analysis

Your waste log feeds directly into the variance calculation that determines how well your bar is controlling beverage cost. Understanding this connection is what makes waste logging more than an administrative chore.

The Variance Formula With Waste Included

Total variance is the difference between actual consumption (from inventory counts and movement records) and theoretical consumption (from recipes multiplied by sales counts). Within that total variance, documented waste explains a portion of the gap. The remainder is unexplained variance.

Unexplained variance = Total variance minus documented waste minus documented comps minus other recorded non-sale use.

If your total variance for a product is $500 in a month, and your waste log shows $180 in documented spills, breakage, and spoilage for that product, the unexplained portion drops to $320. That $320 now deserves focused investigation into over-pouring, receiving errors, transfer discrepancies, or unauthorized use.

Why Waste Should Stay in Total Usage Cost

Do not remove documented waste from your actual usage cost calculation. Waste is real consumption. It is product that left your inventory. Removing it from usage cost makes your cost ratio look better than reality.

Instead, keep waste inside total usage cost for your beverage cost calculation. Then use the waste log to explain a portion of the variance between actual and theoretical cost. The log makes the number actionable. It does not make the number smaller.

How Scannabar Supports Waste Tracking and Variance Analysis

Accurate waste tracking depends on accurate inventory measurement. If your bottle counts are estimates, the variance calculation that your waste log feeds into is unreliable. You cannot accurately determine how much waste explains if you do not know how much total product was consumed.

Scannabar provides the bottle-level measurement precision that makes variance analysis trustworthy. Scannabar's barcode-based bottle measurement, combined with per-bottle calibration, reads the liquid level directly rather than relying on visual estimates. The gap between theoretical and actual usage is based on measured numbers, not rounded guesses. Your waste log then explains a specific portion of that verified gap.

For multi-outlet hotel operations, Scannabar's outlet-level reporting lets you compare waste patterns across locations. A pool bar may produce more spillage due to outdoor conditions. A banquet bar may produce more batch loss due to event timing. Outlet-level data lets you apply corrective action where it belongs rather than averaging waste across locations that operate under different conditions.

In Conclusion: Log the Waste to Find the Real Problem

Unrecorded waste does not disappear from your costs. It hides inside your unexplained variance, inflating a number that management either ignores or misinterprets. A disciplined waste log gives you the documented evidence to separate ordinary operational loss from the variance that actually needs investigation.

Build the log with the right fields. Train your staff to record every event the moment it happens. Analyze cost patterns by item, shift, and reason code. Use that analysis to drive process changes, not blame. Then connect the waste data to your variance reports so you can see whether the changes are working.

Every dollar of documented waste is a dollar you can explain. Every dollar of unexplained variance is a dollar that demands investigation. The waste log is what moves dollars from one column to the other, and that distinction is what turns inventory management from guesswork into evidence-based control.

FAQs About Bar Waste Logs

What is the difference between waste and shrinkage?

Waste is documented product loss from legitimate operational events like spills, breakage, and spoilage. Shrinkage is the total gap between what you should have on the shelf and what you actually count. Waste is one component of shrinkage. Theft, over-pouring, and recording errors account for the remainder. A complete waste log helps you quantify the legitimate portion so you can focus investigation on the unexplained portion.

How often should bartenders log waste events?

Log every event the moment it happens. End-of-shift recall is unreliable: staff forget events, misremember quantities, and lose the context that makes the log entry useful. Place the waste log where it is accessible during service and keep the entry process to under 30 seconds. Scannabar's inventory controls complement real-time waste recording by providing the bottle-level data that connects logged events to period-end variance.

Should complimentary drinks be tracked in the waste log?

Yes. Approved comps consume inventory without generating a sale, which creates variance. Log each comp with the manager who approved it, the product, and the quantity. This is not about restricting comps. It is about making sure comps are visible in your variance analysis so they are not mistakenly attributed to theft or over-pouring.

Can a waste log help reduce insurance claims?

A documented breakage record provides evidence for insurance claims involving recurring equipment failures or delivery damage. If your log shows $400 per month in bottles broken during supplier deliveries, you have documented grounds for a claim or a conversation with your distributor about delivery procedures.

What happens if staff refuse to log waste?

Non-compliance with the waste log inflates your unexplained variance and makes it impossible to identify genuine process problems. Address non-compliance as a training issue first. Reinforce that the log protects staff from false accusations. If a specific employee consistently refuses to log waste while their shifts show higher variance, that pattern itself becomes an investigation signal that your variance data can help identify.

How does Scannabar connect waste logs to variance reports?

Scannabar provides the bottle-level inventory counts and product usage data that establish your total variance. Your waste log explains a portion of that variance with documented events. Together, they produce a clear picture: total consumption, documented non-sale use, and the residual unexplained gap that warrants investigation. That combination turns a single number into an actionable diagnostic.
Topics: Bar inventory, Bar staff, Bar trends, Scannabar Inventory system, Bar drinks, Bar products, Liquor Inventory savings, Bar Promotion, Hotel Bar Inventory, Best Bar Inventory app, Best Liquor Inventory app, Cruise ship bar inventory, Country Club Liquor Inventory, Resaurant Inventory app, Restaurant Inventory app, Scannabar Inventory Software

Hotel Beverage Inventory Transfers: A Practical Guide

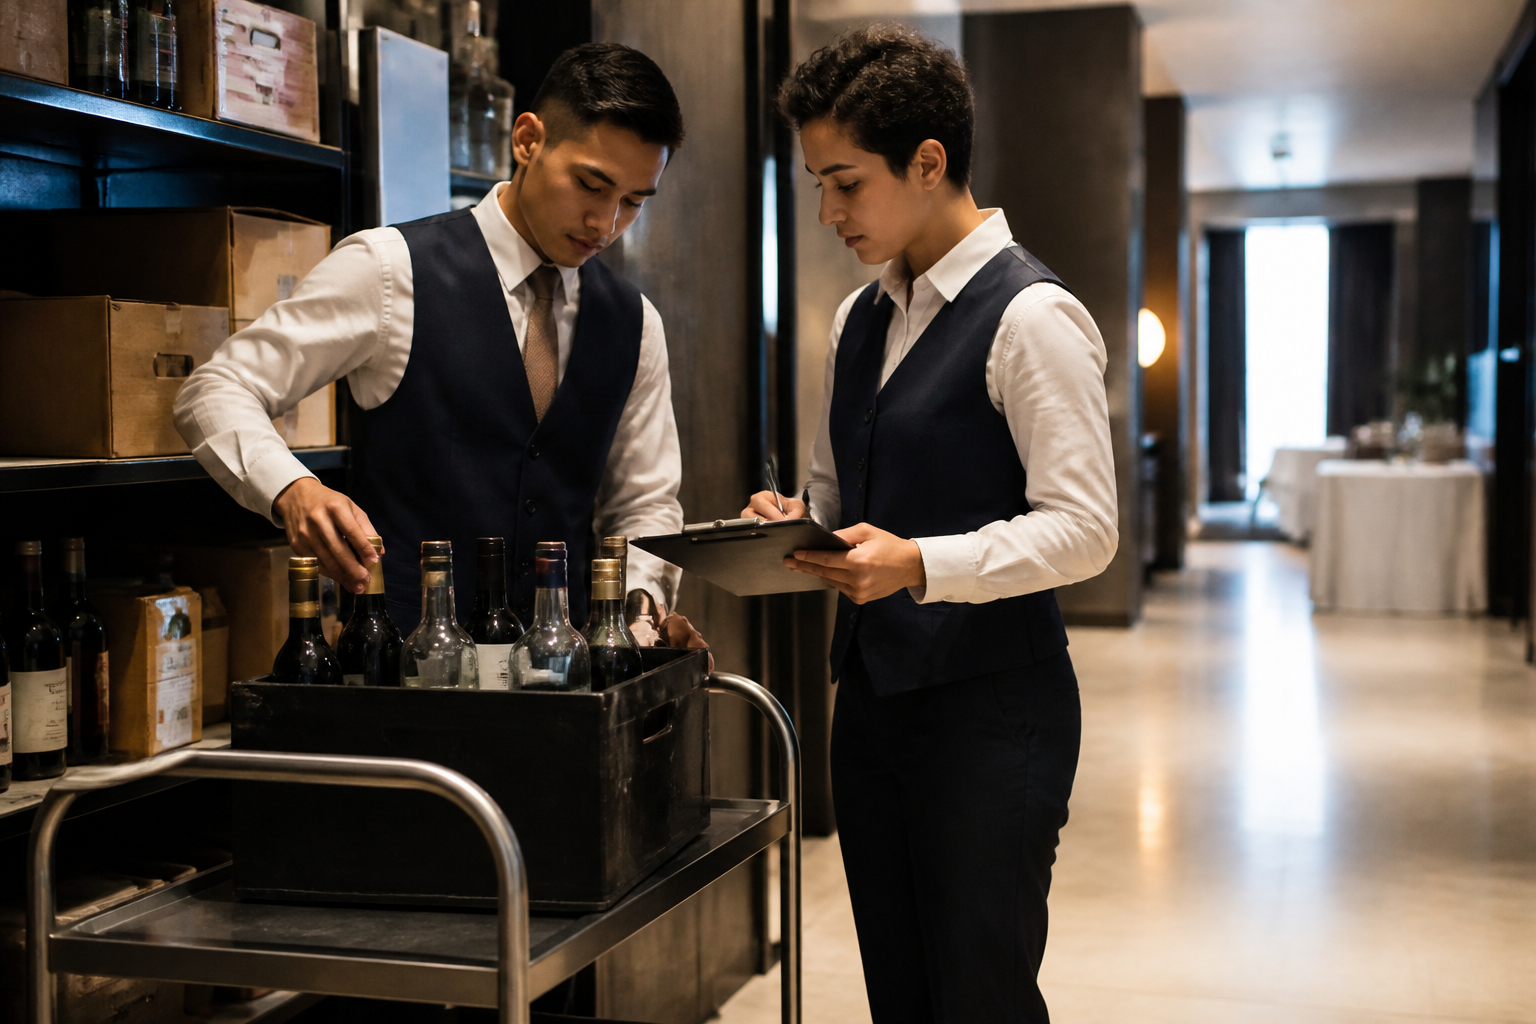
Hotel staff member checking a wine crate in a beverage storeroom

In a hotel with multiple beverage outlets, bottles move constantly. The banquet team pulls vodka from the central storeroom. The pool bar borrows rum from the lobby bar. Room service returns wine that a guest did not open. Every one of those movements changes the inventory at two locations, and if only one side records the transaction, both outlet reports become unreliable.

Untracked transfers are one of the fastest ways to produce phantom variance. A $30 bottle of bourbon that moves from storage to the banquet bar without documentation creates a $30 shortage in storage and a $30 surplus in the banquet bar. Neither number is real. Both waste investigation time. And the staff at the storage location may end up defending a variance they did not cause. FSM.How's guide to beverage control identifies standardized receiving and transfer procedures as foundational to effective hotel beverage management.

This guide covers the transfer types hotel operators manage, the fields your transfer log needs, a worked hotel inventory reconciliation example, and the outlet-level review process that catches exceptions before they compound. The financial examples use hypothetical figures. Apply your own supplier invoices and internal cost records before changing procedures.

Key Takeaways: Hotel Beverage Inventory Transfers

  • Document every bottle that moves between outlets, including storage-to-bar, bar-to-banquet, and returns from any source.
  • A transfer log needs product, quantity, unit cost, sending location, receiving location, authorization, and confirmation fields.
  • Reconcile transfers on both sides to prevent double-counting that inflates one outlet's stock and deflates another's.
  • Scannabar supports multi-outlet inventory tracking that keeps transfer records connected to bottle-level counts and variance analysis.
  • Review outlet-level variance reports weekly and investigate exceptions before they compound across periods.

What Transfer Types Do Hotel Beverage Operations Manage?

Hotel beverage operations handle several distinct transfer types. Each one has different documentation requirements and different risks when it goes unrecorded.

Storage to Service Bars

The most common transfer is stock moving from a central storeroom or receiving area to a service bar. This happens daily in most hotels. The lobby bar needs replenishment. The restaurant bar ran through its gin allocation. The rooftop bar opens for the season and needs an initial stock set.

Every bottle that leaves storage and arrives at a service bar needs a documented transfer record. The sending location records a transfer out. The receiving location records a transfer in. If the storage team sends 12 bottles and the bar team receives 11, that discrepancy must be flagged immediately, not discovered during a month-end count.

Bar to Banquet Transfers

Banquet events create concentrated, high-volume stock movements. A 200-person reception might require 15 bottles of vodka, eight bottles of whiskey, and a case of wine transferred from the central store to the banquet prep area in a single pull.

These transfers are larger than daily bar replenishment and often happen under time pressure. The event is tonight. The banquet manager needs the product now. That urgency is where documentation breaks down. Build the transfer process into your event setup checklist so it happens alongside the physical movement, not as an afterthought.

Returns From Outlets and Events

Not everything that transfers out stays out. A banquet event that pulled 15 bottles of vodka may return four unopened bottles to storage the next morning. The pool bar may send back seasonal products when it closes for the winter. Room service may return wine that a guest declined.

Returns are transfers in reverse, and they require the same documentation rigor. A returned bottle must be logged at both the sending outlet and the receiving location. If the return is not recorded, the receiving location's inventory inflates silently, and the next count shows a surplus that is just as misleading as a shortage.

What Fields Does a Transfer Log Need?

A useful transfer log captures enough detail for variance reconciliation, cost allocation, and audit review. A log that records "6 bottles to banquet" without specifying the product, cost, or authorization is barely better than no log at all.

Required Fields for Every Transfer

FieldWhat It CapturesWhy It Matters
ProductBrand name, bottle size, SKUIdentifies the specific item for cost and inventory matching
QuantityNumber of units transferredDrives the dollar value of the transfer and the adjustment to each location's stock
Unit CostCost per bottle at the time of transferEnsures both locations use the same value, preventing cost discrepancies between outlets
Sending LocationOutlet or storage area originating the transferCreates the transfer-out record that reduces the sending location's inventory
Receiving LocationOutlet or event space accepting the transferCreates the transfer-in record that increases the receiving location's inventory
AuthorizationName or ID of the person approving the transferEstablishes accountability and prevents unauthorized movement of high-value stock
Receiving ConfirmationSignature or acknowledgment by the receiving partyConfirms that the quantity shipped matches the quantity received, catching shortages at the point of transfer
Date and TimeWhen the transfer occurredAligns the movement with the correct reporting period for both locations

Filled Transfer Log Example

The following entries are hypothetical and demonstrate how a completed transfer log looks for a hotel with a central storeroom, lobby bar, and banquet prep area.

DateProductQtyUnit CostFromToAuth.Received
2026-02-10Absolut Vodka 1 L6$22.00Central StoreLobby BarR. PatelD. Kim (6 received)
2026-02-10Maker's Mark 750 mL4$32.00Central StoreBanquet PrepR. PatelS. Hall (4 received)
2026-02-11Maker's Mark 750 mL2$32.00Banquet PrepCentral StoreS. HallR. Patel (2 received)
2026-02-11Pinot Grigio 750 mL3$12.00Room ServiceCentral StoreT. NguyenR. Patel (3 received)

Each row captures the complete movement. The banquet return on February 11 offsets part of the original transfer. The room service return documents wine coming back into the central store. Both adjustments need to appear in the respective outlet reports for the numbers to balance.

How Reconciliation Prevents Double-Counting

The most common error in hotel inventory transfers is recording the movement on one side but not the other. When that happens, property-level inventory may still balance, but outlet-level reports become unreliable. And outlet-level accuracy is where operational accountability lives.

Worked Reconciliation Example

This hypothetical example traces one product, Absolut Vodka 1 L at $22 per bottle, through a two-week period at a hotel with a central storeroom and two service bars. All figures are illustrative.

LocationOpening StockPurchasesTransfers InTransfers OutClosing StockUsage (bottles)
Central Store24123 (returns)14250
Lobby Bar408039
Pool Bar3063 (return)24

At property level, transfers cancel out. The total purchased was 12 bottles. Total closing stock across all three locations is 30 bottles (25 + 3 + 2). Opening stock was 31 (24 + 4 + 3). Property-level usage is 31 + 12 minus 30 = 13 bottles.

At outlet level, the transfers must balance. Central Store transferred out 14 bottles and received 3 returns, a net out of 11. Lobby Bar received 8 transfers in. Pool Bar received 6 and returned 3, a net in of 3. Lobby net in (8) plus Pool net in (3) = 11, matching Central Store's net out. The records balance.

What Happens When One Side Does Not Record

If the Pool Bar's 3-bottle return to Central Store is not recorded on the Central Store side, Central Store's closing stock would appear 3 bottles higher than it should. That surplus might be interpreted as a receiving error, a duplicate invoice entry, or simply ignored. Meanwhile, Pool Bar's records show the return correctly, and its outlet variance looks clean.

The discrepancy only surfaces during a property-wide reconciliation when someone notices that Central Store's numbers do not add up. By then, the period may be closed, and the investigation becomes retrospective rather than preventive.

Record both sides of every transfer at the time it happens. Confirming receipt at the receiving location is what closes the documentation loop.

How to Handle Transfers for Wine and Dry Goods

Wine and dry goods introduce complications that spirit transfers do not. Wine bottle sizes vary. Dry goods are measured in different units than liquor. A case of tonic water from the central store to the pool bar is a transfer, but it may not get the same documentation rigor as a bottle of premium whiskey.

Apply the same transfer log to every product category. If your dry goods program includes mixers, garnish supplies, and packaged beer, those items need transfer records when they move between outlets. A $15 case of tonic water is less dramatic than a $40 bottle of bourbon, but 20 undocumented tonic transfers per month add up to $300 of invisible movement that distorts both outlets' reporting.

For wine, ensure that bottle size is captured in every transfer record. A 750 mL Pinot Noir and a 1.5 L magnum of the same wine are different inventory items. Recording "2 bottles transferred" without specifying the size creates a cost discrepancy that surfaces as false variance at month-end. Include vintage and bin number when your wine program requires that level of tracking.

How to Structure Outlet-Level Reviews

Outlet-level variance review is where transfer accuracy gets tested. If your transfer records are complete, each outlet's variance should reflect only its own operational performance: sales, waste, and any over-pouring that occurred within that outlet.

Weekly Outlet Variance Review

Schedule a weekly review of each outlet's variance report. Compare theoretical consumption (recipes multiplied by POS sales) against actual consumption (opening stock plus transfers in, minus transfers out, minus closing stock). The gap is total variance for that outlet.

If an outlet's variance is unusually high or low, check transfer records first. A missing transfer in can make an outlet look like it used more product than it sold. A missing transfer out can make the sending location look like it has stock it does not actually hold.

Exception Handling for Transfer Discrepancies

When the sending quantity does not match the receiving quantity, flag the exception immediately. Do not wait for period-end reconciliation. Common causes include:

  • A bottle that broke during transport between locations
  • A bottle that was diverted to a different outlet than the one documented
  • A counting error at the point of transfer
  • A bottle size mismatch (750 mL recorded as 1 L or vice versa)

Document the exception, its resolution, and any adjustment to the affected outlet's records. Retain the exception record for audit purposes. Over time, recurring exceptions at the same transfer point reveal a process weakness that needs structural correction rather than repeated investigation.

Quarterly Property-Wide Reconciliation

Run a property-wide reconciliation at least quarterly. Sum all outlet inventories, compare against total purchases, and verify that internal transfers cancel to zero. If they do not cancel, trace the imbalance back to specific products and dates using your inventory records.

A property-wide reconciliation also catches systemic errors: a consistent unit mismatch between two outlets, a receiving location that routinely forgets to confirm transfers, or a category of product (often wine) that moves between outlets without standard documentation because "it's only wine."

How Scannabar Supports Hotel Transfer Management

Hotel beverage operations need inventory tracking that spans multiple outlets without losing the granularity required for outlet-level accountability. A single bar is straightforward. A hotel with a lobby bar, pool bar, restaurant bar, banquet prep area, and central storeroom is a network of stock movements that requires consistent documentation and reconciliation.

Scannabar's multi-outlet inventory system tracks every bottle from receiving through transfer, service, and depletion. Each outlet maintains its own stock record within a single system, so transfers between locations are visible to every stakeholder without requiring separate spreadsheets or manual reconciliation.

Barcode scanning at the point of transfer captures the product, quantity, and movement direction. The receiving outlet confirms the transfer when it scans the bottles in. That confirmation step is what prevents the one-sided recording errors that create phantom variance in outlet-level reports.

For hotel F&B directors reviewing multiple outlets, Scannabar's centralized reporting provides a single view of stock levels, usage reports, and variance across the property. You can compare outlet performance, identify transfer patterns that need attention, and verify that internal movements balance without waiting for a quarterly reconciliation to surface the problems.

In Conclusion: Track Every Bottle That Moves

Hotel beverage inventory transfers are not an administrative afterthought. They are the mechanism that keeps outlet-level accountability intact. Every undocumented transfer creates a discrepancy that wastes investigation time, distorts purchasing decisions, and potentially places blame on staff for a variance they did not cause.

Build transfer documentation into your daily workflow, not your month-end cleanup. Record both sides of every movement. Confirm receipt at the point of delivery. Flag exceptions immediately. And reconcile at the outlet level weekly so that property-wide surprises never accumulate.

The cost of documenting transfers is measured in minutes per day. The cost of not documenting them is measured in thousands of dollars per year of inflated variance, excess purchasing, and investigations that chase the wrong cause. Those minutes pay for themselves before your first weekly variance review is finished.

FAQs About Hotel Beverage Inventory Transfers

What is the biggest risk of untracked beverage transfers in a hotel?

Phantom variance. An unrecorded transfer creates a shortage at the sending location and a surplus at the receiving location, neither of which reflects actual consumption. This distorts outlet-level variance reports, triggers unnecessary investigations, and can lead to unjustified accusations against staff who had nothing to do with the discrepancy.

How should banquet transfers be documented differently from daily replenishment?

Banquet transfers should use a pre-event pull sheet that lists every product, quantity, and authorization before the stock moves. Post-event, count and document returns immediately. Daily replenishment follows the same transfer log format but happens at a regular cadence with smaller quantities. Both require two-sided documentation, but banquet transfers benefit from the pre-event planning step.

Can Scannabar track transfers between specific hotel outlets?

Scannabar's hotel inventory system tracks stock by outlet within a single property-wide account. Transfers between outlets are recorded with barcode scanning at both the sending and receiving locations. Outlet-level variance reports reflect these movements accurately so each bar manager sees only their own operational performance.

How do you prevent double-counting when a bottle is transferred and then returned?

Record the return as a reverse transfer: the outlet that originally received the bottle records a transfer out, and the original sending location records a transfer in. Both movements must appear in the records. At period-end reconciliation, the original transfer and the return offset each other, leaving only the net movement in each outlet's consumption calculation.

What should happen when the receiving count does not match the sending count?

Flag the discrepancy immediately, while the people involved can still recall the circumstances. Investigate common causes: breakage during transport, a bottle diverted to a different outlet, a counting error, or a unit mismatch. Document the resolution and adjust the affected records. Do not wait for month-end to address a difference that can be resolved the same day.

How often should hotel operators reconcile transfers across outlets?

Review outlet-level variance weekly and run a full property-wide transfer reconciliation at least quarterly. Weekly reviews catch most errors before they compound. The quarterly reconciliation verifies that internal transfers cancel to zero across all outlets and surfaces systemic documentation gaps that weekly reviews may miss. Scannabar's centralized reporting supports both cadences.

Topics: Bar inventory, Restaurant Inventory, Bar Management, Liquor Inventory savings, Hotel Bar Inventory, Cruise ship bar inventory, Country Club Liquor Inventory

How to Cost a Cocktail Tasting Event 2026

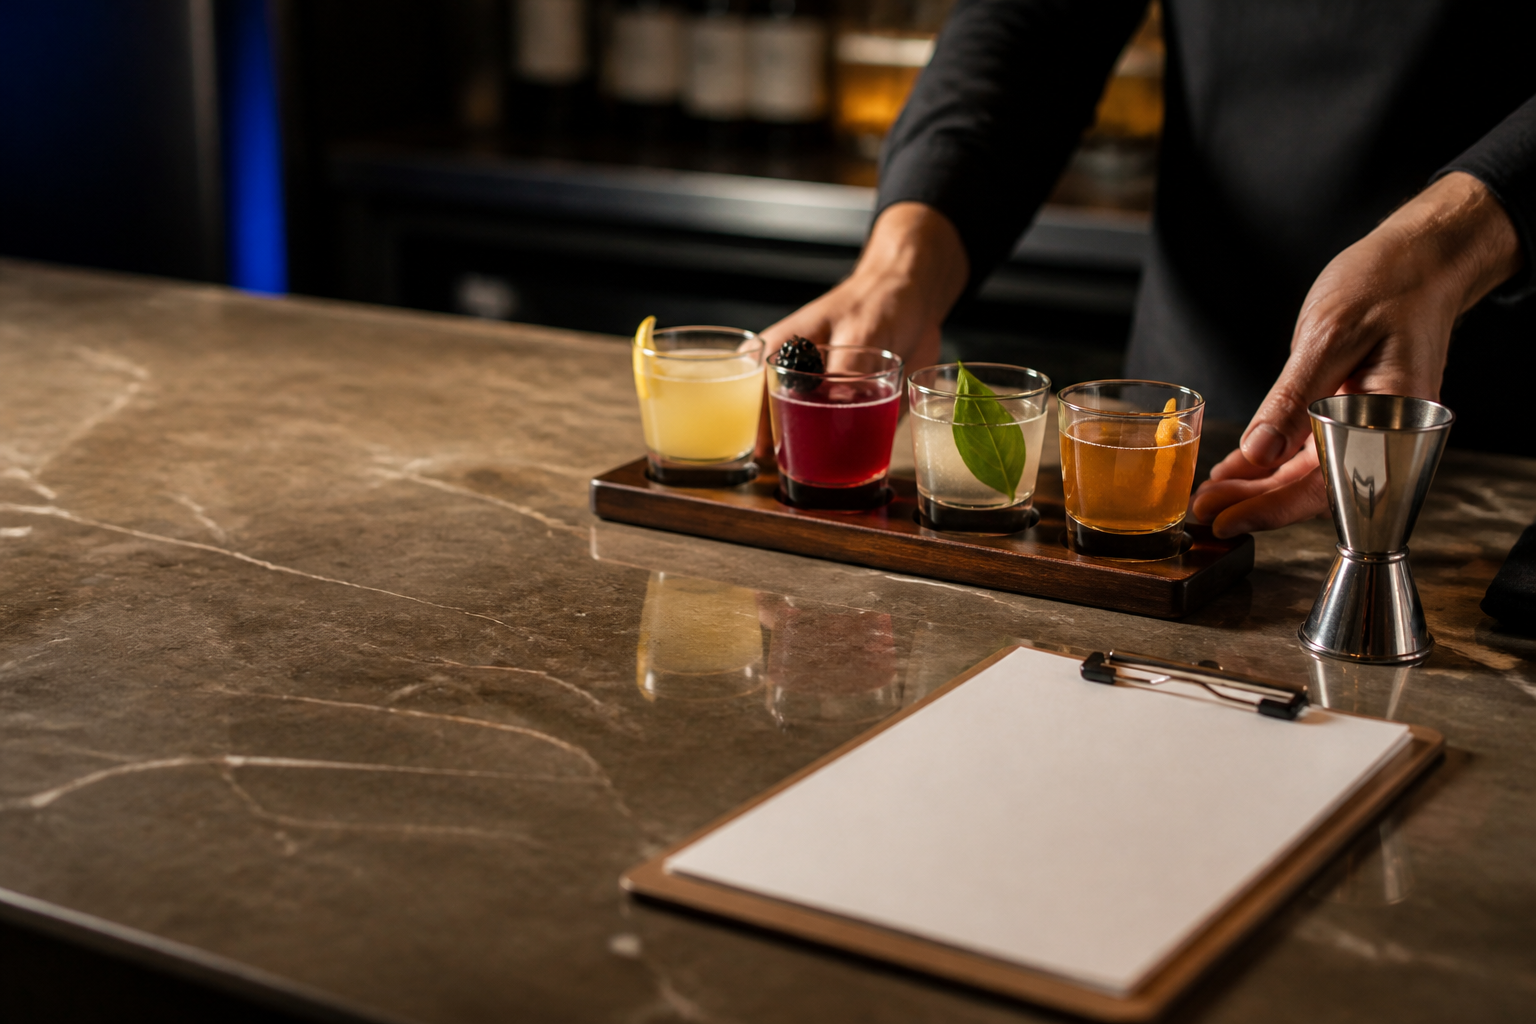
Flight of cocktail tasting portions arranged on a warm hospitality bar counter

A cocktail tasting event can produce strong revenue in a single evening, but only if the ticket price covers what the night actually costs. Many operators price the pour and forget the person pouring it, the prep labor behind the batches, and the contingency that protects margin when the unexpected happens.

This guide walks you through a bottom-up costing method for a cocktail tasting event: portions and ingredient costs, staffing and other operating expenses, ticket pricing and break-even calculation, opening stock and transfers, contingency planning, and a post-event profitability review. Every financial figure in this guide is hypothetical and illustrative. Use your own supplier invoices, labor rates, and venue costs before setting a ticket price.

Key Takeaways: Costing a Cocktail Tasting Event

  • Cost every line item before setting a ticket price: ingredients, staffing, supplies, venue expenses, and a contingency buffer.
  • Calculate your break-even guest count so you know the minimum ticket sales needed to cover fixed costs.
  • Set up opening stock transfers from your main inventory and document every bottle that moves to the event space.
  • Scannabar supports the inventory tracking that lets you reconcile event stock against actual consumption after the evening ends.
  • Review actual profitability against your projections to improve costing accuracy for the next event.

Why Bottom-Up Costing Protects Your Margin

The fastest way to underprice a tasting event is to start with a pour cost target and work backward. An 18% pour cost tells you what the spirit costs per ounce. It says nothing about the four hours of prep labor, the extra glassware rental, the printed tasting cards, or the two staff members you need behind the bar.

Bottom-up costing works the other direction. Add up everything the event actually costs, divide by a realistic guest count, and only then check the result against industry pour cost ranges as a sanity check. FSM.How's guide to beverage control notes that average pour costs for hotel and bar operations typically range from 18% to 24%, which provides a useful reference point for tasting-event pricing. The pour cost becomes a verification step, not a starting point.

For a bar generating $500,000 in annual revenue, a single under-priced event that loses $2,000 is a rounding error on the P&L. Run four under-priced events per quarter and you have an $8,000 annual drag on margins that could have been prevented by spending one hour on the math before printing the first ticket.

How to Calculate Portion and Ingredient Costs

Start with the drinks themselves. Define the format: how many cocktails per guest, what size each pour will be, and what ingredients each recipe requires.

Define Portions Per Guest

A standard tasting format serves three to five cocktails per guest, with portions smaller than a full menu cocktail. A two-ounce tasting pour is common. If you are serving four cocktails at two ounces each, every guest consumes eight ounces of finished cocktail, which translates to a specific volume of each ingredient based on your recipes.

Multiply per-guest consumption by your expected guest count. For a 40-person event serving four cocktails each, you are producing 160 individual drinks. That volume drives every purchasing and preparation decision.

Cost Each Recipe at Tasting Portions

Use your actual supplier invoices to cost each tasting cocktail at its reduced portion size. A recipe that costs $2.80 per full-size serving may cost $1.50 per tasting pour, depending on the ingredients and their proportional scaling.

Include every component: base spirit, modifiers, syrups, citrus, garnishes, and ice. Do not estimate garnish cost as zero because "you already have limes." Those limes have a cost, and at tasting-event volume, garnish consumption is concentrated into one evening rather than spread across a week of service.

The following hypothetical table illustrates a four-cocktail tasting menu costed at tasting portions:

CocktailTasting PortionIngredient Cost per Serve
Citrus Gin Fizz2 oz finished$1.40
Bourbon Smoked Sour2 oz finished$1.85
Mezcal Paloma2 oz finished$1.60
Rum Old Fashioned2 oz finished$1.55

Total ingredient cost per guest: $6.40. For 40 guests: $256.00 in total ingredient cost. These figures are hypothetical. Your actual ingredient costs will vary based on your recipes and supplier pricing.

How to Calculate Staffing and Other Operating Costs

Ingredients are rarely the largest cost of a tasting event. Staffing, supplies, and operational overhead often exceed the ingredient bill, especially when the event requires preparation the day before.

Staffing Costs

Break staffing into three phases: preparation, service, and breakdown. Your bartender may spend four hours batching syrups, juicing citrus, and prepping garnishes the day before, then five hours on the event night itself (setup, service, and cleanup). That is nine hours of labor per bartender.

If you need two bartenders for service and one barback, calculate their combined hourly cost including any applicable taxes and benefits. For a hypothetical $22 per hour average, two bartenders for nine hours each ($396) and one barback for six hours ($132) produces a staffing total of $528.

Supplies and Venue Costs

List every non-ingredient expense the event requires. Common line items include:

  • Glassware rental or disposable tasting cups
  • Printed tasting cards or menus
  • Ice (purchased or produced, at actual cost)
  • Napkins, straws, and bar consumables
  • Any venue-specific charges (room rental, A/V, additional insurance)

For a hypothetical 40-person event, these costs might total $180. Larger events in rented spaces can run significantly higher. Get actual quotes before your costing is complete.

Total Operating Costs

Combine your ingredient, staffing, and supplies totals:

Cost CategoryAmount
Ingredients (40 guests x $6.40)$256.00
Staffing (2 bartenders + 1 barback)$528.00
Supplies and venue$180.00
Subtotal before contingency$964.00

How to Set Ticket Pricing and Calculate Break-Even

With your total cost established, ticket pricing becomes an arithmetic exercise rather than a guessing game. The question is how many guests you need at what price to cover your costs and deliver your target profit.

Add a Contingency Buffer

Build a 10% to 15% contingency into your cost estimate. Unexpected costs surface in every event: a bottle that breaks during setup, a garnish order that runs short, a last-minute staffing addition. A contingency buffer absorbs these surprises without pushing the event into a loss.

For our hypothetical event, a 15% contingency on the $964 subtotal adds $144.60, bringing the total estimated cost to $1,108.60.

A Clearly Labeled Illustrative Break-Even Calculation

This example uses the hypothetical figures above. These are not recommended prices, supplier costs, or guaranteed outcomes.

Total estimated cost: $1,108.60. Target profit: $800 (an operator-defined goal for the evening). Required gross revenue: $1,908.60.

At 40 guests: $1,908.60 divided by 40 = $47.72 per ticket. Round to a clean price point: $50 per ticket.

At $50 per ticket with 40 guests, gross revenue is $2,000. After estimated costs of $1,108.60, the projected profit is $891.40.

Break-even guest count at $50 per ticket: $1,108.60 divided by $50 = 22.17, meaning you need at least 23 paid guests to cover costs. Every guest beyond 23 contributes approximately $43.60 in profit (ticket price minus per-guest ingredient cost of $6.40).

Check the Pour Cost as a Sanity Step

Ingredient cost per guest ($6.40) divided by ticket price ($50) equals a 12.8% pour cost. For a tasting event with premium spirits and labor-intensive preparation, this is within a reasonable range. If your pour cost calculates above 25% for a tasting format, revisit either your ingredient costs or your ticket price.

The pour cost check confirms your pricing is in a sensible range. It does not replace the bottom-up costing that established the ticket price. Those are two different functions.

How to Manage Opening Stock and Transfers

Tasting events pull stock from your main bar inventory. If those transfers are not documented, the main bar's variance report will show unexplained consumption, and the event's actual cost will be impossible to calculate.

Create a Pre-Event Pull Sheet

Before the event, prepare a transfer document listing every product that will move from your main inventory to the event space. Include product name, bottle size, quantity transferred, unit cost, and the name of the person authorizing the transfer.

This pull sheet serves two purposes. First, it tells your event team exactly what they will have to work with. Second, it creates the documentation your inventory system needs to reconcile the main bar's stock after the bottles leave the building or the storeroom.

Document Transfers on Both Sides

The sending location (main bar or storeroom) records a transfer out. The receiving location (event space) records a transfer in. Both sides of the movement must be captured so that neither location shows a phantom surplus or shortage.

For hotel operators managing events across multiple outlets, this is especially critical. A banquet prep area that borrows six bottles of vodka from the lobby bar storeroom can create a $120 discrepancy in the lobby bar's variance report if the movement is not recorded. That discrepancy wastes investigation time and potentially triggers an unfair review of lobby bar staff.

Plan for Contingency Stock

Pull slightly more product than your recipe calculations require. If your recipes call for three bottles of gin for 40 guests, transfer four. The fourth bottle is your safety margin against over-pouring, an extra guest or two, or a batch that does not turn out correctly.

Document the contingency stock on the same pull sheet. After the event, count what remains and record the return transfer. The difference between what you sent and what came back, minus documented waste, is your actual event consumption.

How to Handle Leftovers and Calculate Actual Profitability

The event ends. Guests leave. What remains on the event bar, in the batching station, and in the prep area tells you whether your costing was accurate.

Count and Return Unused Stock

Immediately after breakdown, count every unopened bottle and measure every open bottle that can return to the main inventory. Record the return transfer with the same detail as the original pull: product, quantity, condition, and the person handling the return.

Opened bottles that are not suitable for return to the main bar (due to quality, cross-contamination, or house policy) should be logged as event waste. Their cost belongs in the actual event cost, not in the main bar's unexplained variance.

Calculate Actual Consumption

Actual consumption = Opening transfer minus return transfer minus documented event waste. Convert that consumption into a dollar cost using the same unit costs from your original costing.

For our hypothetical event, if the opening transfer was $380 worth of spirits, $48 returned unused, and $15 was documented as event waste, actual ingredient consumption is $380 minus $48 minus $15 = $317. The planned ingredient budget was $256. The $61 overage reflects over-pouring, additional guests, or batch adjustments during the event.

Compare Projected and Actual Profitability

Lay the projected figures next to the actual results:

CategoryProjectedActualVariance
Ticket revenue (42 guests at $50)$2,000$2,100+$100
Ingredient cost$256$317+$61
Staffing$528$550+$22
Supplies and venue$180$175-$5
Total cost$964$1,042+$78
Net profit$891$1,058+$167

This hypothetical event produced $167 more profit than projected, primarily because two additional guests purchased tickets. The ingredient overage and slight staffing increase were absorbed by the extra revenue and the unused contingency budget.

Document Lessons for the Next Event

Record what went right and what went wrong in a brief post-event review. Were portions consistent? Did you run short on any ingredient? Was staffing adequate for the guest count? Did the contingency buffer cover the unexpected costs?

These notes become the costing foundation for your next event. Each tasting you run should produce a tighter cost estimate than the last, reducing the contingency buffer you need and increasing the confidence behind your ticket price.

How Scannabar Supports Event Inventory Management

Tasting events create concentrated stock movements: a burst of transfers, a night of consumption, and a return of unused product. Without precise tracking, the event's actual cost blurs into your regular bar operations.

Scannabar's liquor inventory system tracks every bottle from receiving through transfer, consumption, and return. For event management, that means you can measure exactly what left the storeroom, what was consumed during the event, and what came back. Your event cost is calculated from verified stock data, not estimates.

For hotel operators running banquet tastings or private dining events, Scannabar's multi-outlet tracking keeps event inventory separate from daily bar operations. The banquet's variance does not contaminate the lobby bar's variance, and both outlet managers can review their own results independently.

In Conclusion: Price the Event From Cost, Not From Hope

A profitable cocktail tasting event starts with a costing sheet, not a ticket price. Calculate every ingredient, labor hour, and supply cost before you set the price. Build a contingency buffer that protects your margin against the inevitable surprises. Then sell tickets at a price that covers the full cost and delivers a profit you can justify.

After the event, close the loop. Count what remains. Calculate actual consumption. Compare projected and actual results. Use the difference to improve your next event's accuracy. Each tasting should be more profitable than the last because each costing gets tighter.

The alternative is pricing by instinct, hoping enough guests show up to cover costs you never calculated. For a bar that runs multiple events per year, that hope accumulates into thousands of dollars in preventable losses. Do the math once, and let the numbers run every event that follows.

FAQs About Costing a Cocktail Tasting Event

How many cocktails should a tasting event include per guest?

Three to five cocktails at tasting portions (1.5 to 2.5 ounces finished) is a standard range. Fewer than three feels sparse. More than five creates diminishing returns in guest experience and increases your ingredient cost. Match the number to your event duration and the complexity of your menu. A 90-minute event supports four cocktails comfortably.

Should you include food costs in the ticket price?

If you are serving food pairings, those costs belong in your bottom-up costing alongside ingredients and staffing. Cost each food item per guest, add it to the subtotal, and factor it into your ticket price. Do not treat food as a "bonus" that comes out of the kitchen's budget. Every expense that the event generates should appear in the event's cost sheet.

How do you handle no-shows and last-minute cancellations?

Your break-even calculation provides the cushion. If your event breaks even at 23 guests and you sell 40 tickets, five no-shows still leave you at 35 guests and a comfortable profit. Consider requiring prepayment to reduce no-show risk. If you offer refunds, set a cutoff date that aligns with when you place ingredient orders.

Can Scannabar help track event-specific inventory separately?

Scannabar tracks inventory by outlet and location, so event stock can be managed independently from daily bar operations. Transfer documentation and post-event return counts keep event consumption isolated. That separation means your event cost is calculated from verified figures, and your regular bar variance is not distorted by the event.

What is a reasonable contingency percentage for a tasting event?

Build a 10% to 15% contingency into your total cost estimate. First-time events should lean toward 15% because you have less data to predict unexpected costs. As you run more events and refine your costing, the contingency can decrease because your estimates become more accurate.

How do you determine actual profitability after the event?

Subtract all actual costs (ingredients consumed, staffing hours, supplies, and documented waste) from actual ticket revenue and any additional revenue such as drink upgrades or merchandise sales. Compare this figure to your projected profit. The variance between projected and actual is the data that makes your next event's costing more precise.

Topics: Hotel Bar Inventory, Best Bar Inventory app, Best Liquor Inventory app, Cruise ship bar inventory, Country Club Liquor Inventory, Scannabar inventory app, Resaurant Inventory app, Scannabar Inventory Software

Bar Inventory Software for Hotels and Hospitality Groups 2026

Most bar operators know shrinkage exists. Fewer know how much profit it drains every week, or how long their counting method delays the moment they catch it. For a bar generating $500,000 in annual beverage revenue, a shrinkage rate of 20% to 25% translates to $100,000 to $125,000 walking out the door every year.

This guide breaks down what purpose-built bar inventory software should do, where generic tools fall short for hotels and multi-location hospitality groups, and how to evaluate monthly costs against the real return: faster counts, earlier variance alerts, and tighter liquor control across every bar you operate.

Hotel bar manager scanning liquor bottles with a handheld device before service
Serialized bottle tracking gives hotel and bar teams a faster way to count inventory and catch variance earlier.

Key Takeaways: Bar Inventory Software for Hotels and Hospitality Groups

  • Generic inventory tools miss bottle-level tracking, leaving variance undetected until thousands of dollars have already disappeared.
  • Serialized bottle tracking ties every ounce to a specific location, shift, and bartender for precise accountability.
  • POS integration closes the loop between what you sold and what you poured, exposing heavy pours and theft in real time.
  • Scannabar reduces shrinkage to 1% to 3% from industry averages near 25%, with clients reporting 25% to 50% beverage cost reductions.
  • Evaluating monthly software cost requires measuring labor savings, variance reduction, and faster decision-making alongside the subscription price.

Why Generic Inventory Tools Miss the Real Cost of Liquor Variance

Standard inventory platforms track quantities at the SKU level. They can tell you that you have 14 bottles of a particular bourbon on hand. They cannot tell you that three of those bottles are 60% depleted, one has been open for six weeks, and another has moved to the banquet prep area without a transfer record.

That gap matters because liquor variance hides in the details. A bottle that goes unaccounted for at a single-unit bar is a nuisance. A bottle that goes unaccounted for across 12 hotel bars, two banquet stations, and a rooftop lounge is a systemic blind spot that compounds every week you fail to catch it.

How Slow Counts Delay Variance Detection

Counting by hand is still the default at most bars. The math is brutal. A well-stocked bar carrying 80 to 120 open bottles takes 45 minutes to an hour to count by hand. Multiply that across multiple bars in a hotel property, and you are looking at a full shift dedicated to counting rather than serving.

The bigger problem is frequency. When counting takes that long, operators push it to once a month or once a quarter. That delay means variance builds silently. heavy pours, spillage, theft, and breakage accumulate for weeks before anyone sees the numbers.

By the time a monthly count reveals a $4,000 discrepancy, the damage is done. You have no way to trace which shift, which bartender, or which bar station contributed to the loss. The money is gone. The behavior that caused it has been repeating unchecked for 30 days.

Why Bars, Hotels, and Multi-Location Groups Need Different Controls

A standalone neighborhood bar and a 300-room hotel with four beverage outlets have fundamentally different control requirements. The bar owner needs speed and accuracy for a single location. The hotel F&B director needs centralized visibility across bars, banquet stations, minibars, and poolside service points, each with different par levels, different product mixes, and different staff rotations.

Multi-location hospitality groups add another layer. They need standardized processes across properties so that variance data is comparable, purchasing is aggregated, and a new bar manager in Miami follows the same counting protocol as the veteran in Nashville. Generic tools rarely offer that kind of operational standardization.

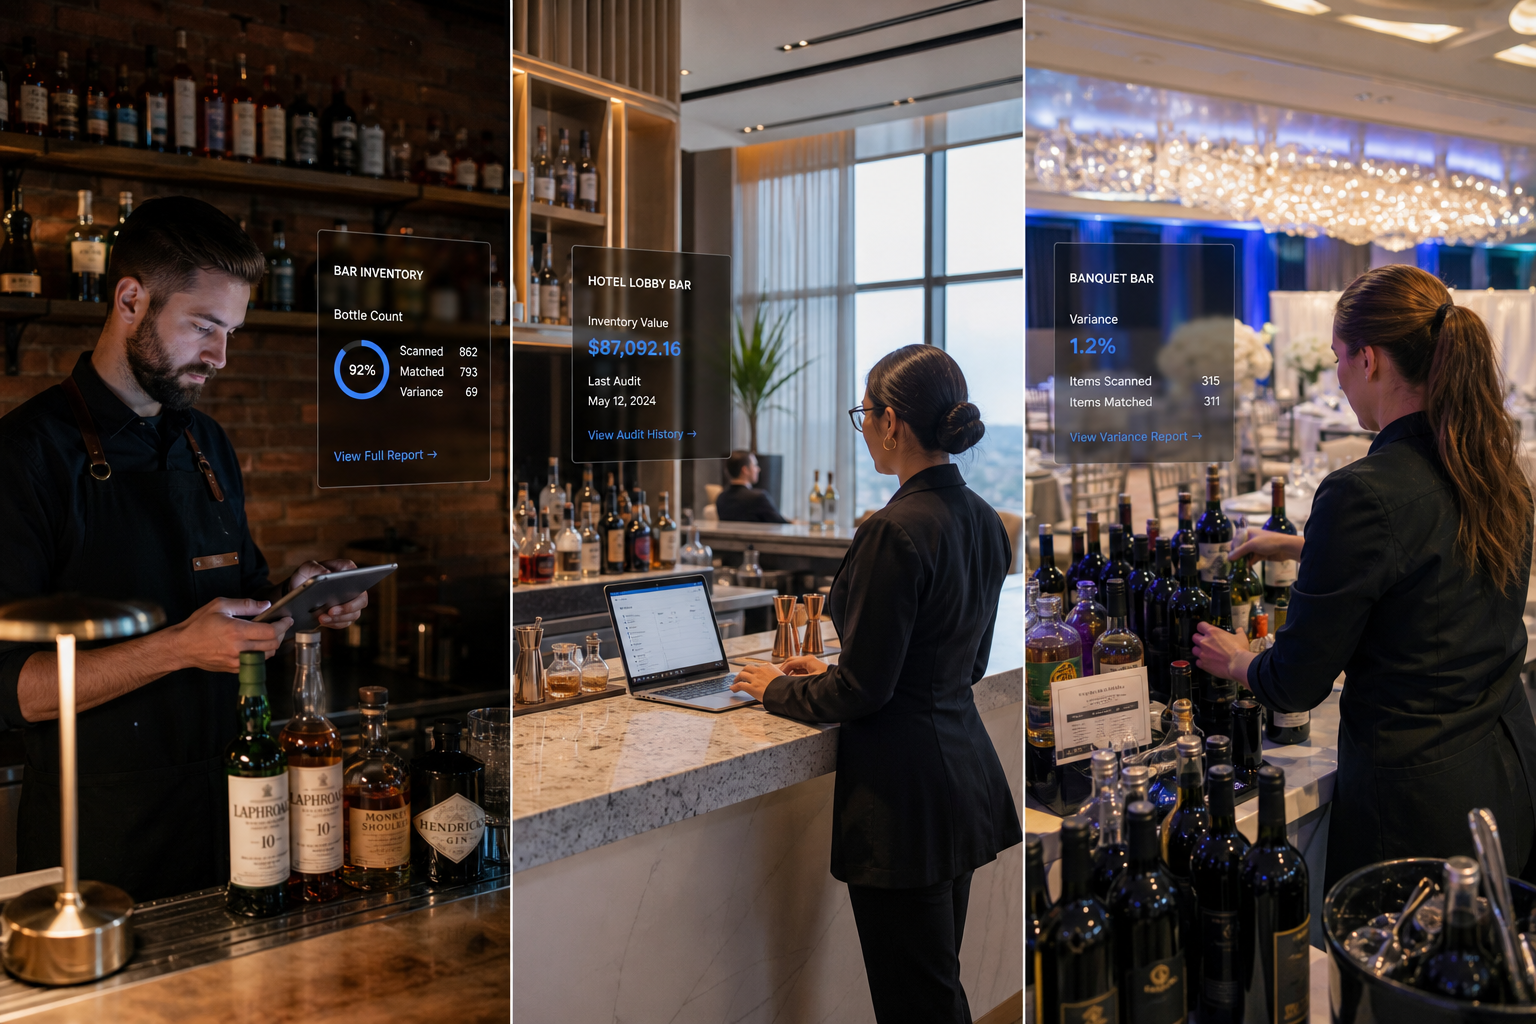
Independent bar, hotel bar, and banquet bar setups showing different hospitality inventory environments
Bars, hotels, and multi-location groups need different inventory controls, but they all need accurate variance visibility.

What Bar Inventory Software Should Include

Not every platform calling itself bar inventory management software delivers the controls that hospitality operators need. The features below separate purpose-built hospitality tools from adapted warehouse or retail inventory systems.

What Serialized Bottle-Level Tracking Changes

Serialized tracking assigns a unique identity to every bottle the moment it enters your building. This approach is what makes liquor inventory precise at the bottle level.

When that bottle is scanned during receiving, the software creates a profile containing brand, volume, cost, and dimensional data. From that point forward, every measurement and every transfer is logged against that specific bottle.

If a bottle disappears from a service well between Tuesday's close and Wednesday's open, the system flags exactly which bottle is missing and where it was last recorded. That specificity separates precise liquor control from general-purpose inventory management.

Scannabar builds its entire system around this principle. Each bottle receives a bar-coded tracking label at receiving, and the software monitors its contents from the first pour to the final drop. The result is perpetual inventory that tracks every ounce, not just every case.

Why POS Integration Matters for Liquor Control

Inventory data without sales data is only half the picture. You know what you had and what you have now, but you do not know what should have been consumed based on actual register activity.

POS integration closes that gap. The software compares theoretical consumption (what your recipes say you should have poured) against actual consumption (what the count shows). The difference is your variance, and it points you exactly where to look.

A bar running 5% variance on well vodka might seem acceptable until you calculate the dollars. On a product moving 15 bottles a week at $18 per bottle, that variance costs roughly $700 a year on one SKU. Multiply across your full product line and the total adds up fast.

Scannabar integrates with POS platforms including Aloha, Micros, and InfoGenesis, creating a closed-loop system where counts, sales, and variance reports feed from the same data source.

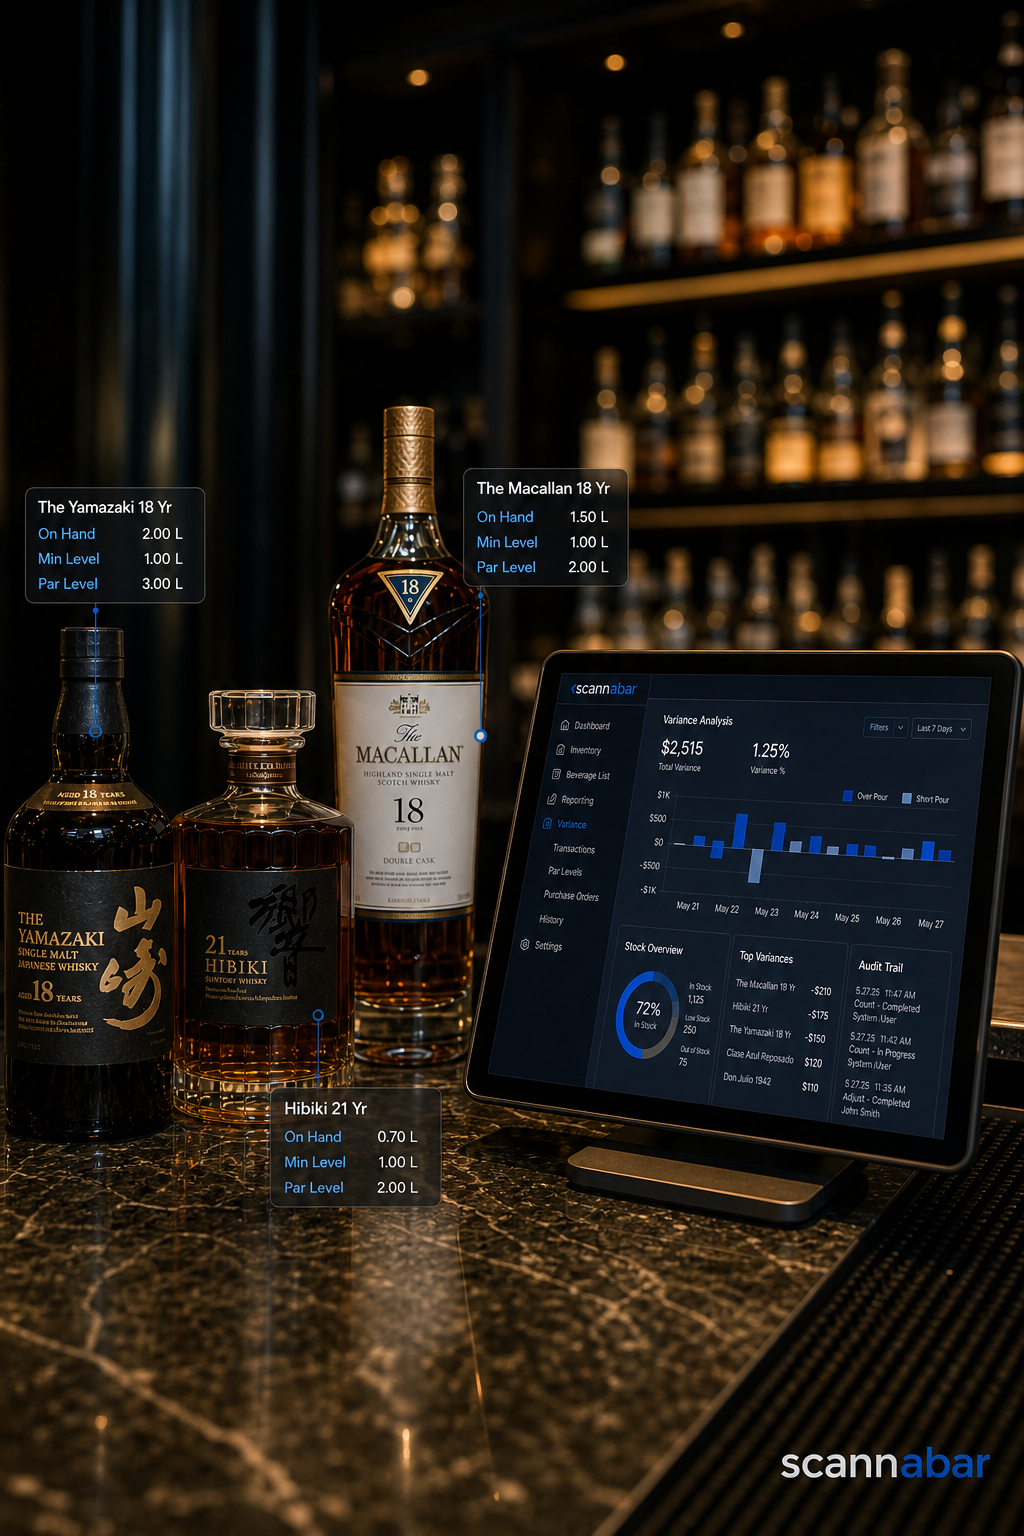
Inventory and POS reporting screen beside liquor bottles at a working bar station
POS integration helps operators compare sales data with actual usage so variance shows up faster.

How Barcode and Bottle-Based Counts Reduce Labor

Speed is not a luxury when you are managing inventory across multiple bars. Barcode scanning eliminates the clipboard-and-calculator process that eats hours every count cycle. Instead of reading labels, estimating fill levels, and writing numbers on a spreadsheet, your staff scans each bottle and lets the software calculate contents automatically.

Scannabar's system measures the contents of 120 bottles in roughly 15 minutes. A property running four bars can complete a full-property count during a single shift, which means you can count daily or after every shift without pulling staff away from revenue-generating work.

That frequency changes everything. Daily counts catch variance within 24 hours instead of 30 days. Weekly counts give you trend data that exposes patterns such as a particular bartender consistently running higher variance on premium spirits during Friday night shifts.

How Scannabar Fits Hospitality Operations

Scannabar was built for hospitality operators. It was not adapted from a warehouse platform or bolted onto a POS system as an afterthought. The system serves bars, restaurants, hotels, nightclubs, golf and country clubs, and cruise ships across the U.S. and Canada.

How Scannabar Supports Bar Operators

For independent bar owners and managers, Scannabar delivers bottle-level tracking without the overhead of enterprise software. The hand-held scanning unit is simple enough that any staff member can perform a count after minimal training.

The system flags missing bottles, calculates variance, and generates reports that show you exactly where your dollars are going. You can read more about how inventory tracking improves profitability across bar operations.

The practical result is a culture of accountability that protects both your profits and your staff. When bartenders know that every bottle is individually tracked, heavy pours and unrecorded drinks decline without you needing to stand behind the bar watching every pour. Staff members are protected from false accusations because the data is precise and defensible.

How Scannabar Supports Hotel Beverage Teams

Hotels present unique inventory challenges. A single property may operate a lobby bar, a rooftop lounge, a pool bar, a restaurant bar, and multiple banquet and event stations. Product moves between these locations constantly, and each outlet may carry a different product mix with different par levels.

Scannabar handles multi-outlet properties with a single system. Inventory transfers between bars are tracked on the portable hand-held device, so the F&B director always knows which bottles are at which location. The system works at fixed bars, portable bars, and outdoor event stations, giving hotel teams centralized visibility from one process.

Properties operating under brands like Ritz Carlton, Hyatt, Sheraton, and Intercontinental already rely on Scannabar for this kind of hotel-wide liquor control.

How Scannabar Supports Multi-Location Groups

Hospitality groups managing multiple properties need two things generic tools rarely deliver: standardized counting processes and cross-location performance comparison. If every location counts differently, your variance data is not comparable and your purchasing decisions are based on inconsistent information.

Scannabar standardizes the entire process. Every location uses the same scanning hardware, the same software, and the same measurement methodology. That means a 3% shrinkage reading at your Nashville property and a 7% reading at your Miami property are directly comparable, and you can investigate the difference immediately.

Aggregated purchasing data across locations also strengthens your position at the distributor table. When you can show a supplier exact consumption volumes across 10 or 20 properties, you are negotiating from hard numbers, not estimates.

How to Compare Monthly Software Costs the Right Way

Price comparison is where most buyers go wrong first. They line up monthly subscription fees on a spreadsheet and pick the lowest number. That approach ignores the biggest cost of all: what each platform fails to catch.

What to Measure Beyond Subscription Price

Start with labor. How many hours does your team currently spend counting inventory each month? Multiply those hours by your loaded labor rate. If a platform cuts counting time by 75%, that labor savings alone may cover the subscription several times over.

Next, measure variance detection speed. A system that catches a $200-per-week loss in the first week saves you $800 compared to a system that catches it at the end of the month. Over a year, faster detection on just a handful of products can represent thousands of dollars.

Then look at integration costs. Some platforms charge separately for POS integration, for additional locations, or for report customization. Scannabar includes software support and upgrades at no additional charge, with no yearly or monthly licensing fees beyond the initial system cost. That pricing structure eliminates the hidden costs that inflate the total expense of subscription-based alternatives.

How Faster Counts and Earlier Alerts Affect ROI

If your current counting method takes 8 hours per month across all locations and a barcode-based system reduces that to 2 hours, you recover 6 hours of labor every month. At $25 per hour loaded, that is $150 in direct monthly savings.

Many Scannabar clients report reducing shrinkage to 1% to 3% from previous levels near 25%. For a bar doing $500,000 in annual beverage sales, dropping from 25% to 3% recovers $110,000 per year. A more conservative improvement to 10% still recovers $75,000.

The ROI timeline for most operators is weeks, not months. According to the National Restaurant Association's 2025 cost analysis, keeping beverage cost ratios in check remains a top priority across the industry.

Scannabar clients generally see a 25% to 50% reduction in beverage costs within the first few weeks. That rapid payback should anchor your cost comparison, not the subscription line item.

What Questions to Ask Before Choosing a Bar Inventory Platform

Before signing a contract, put each vendor through questions that reveal whether their platform was built for hospitality or adapted from another industry.

Does the System Track Individual Bottles or Only SKU Quantities?

SKU-level tracking tells you totals. Bottle-level tracking tells you where every ounce went. If you need to identify a missing bottle at a specific bar station, only serialized tracking delivers that answer.

How Does the System Measure Partial Bottles?

Estimating fill levels by eye introduces the same human error you are trying to eliminate. Look for calibrated measurement tools, whether that is a bar-coded ruler, a scale, or another precision method.

What POS Systems Does the Platform Integrate With?

Confirm that your current POS is supported natively. A third-party middleware layer adds cost, extra configuration, and potential points of failure.

Can the System Handle Multi-Location Operations?

Ask how variance data is standardized across properties. Can you compare shrinkage rates between locations using the same methodology? Can you aggregate purchasing data for distributor negotiations?

What Is the Total Cost of Ownership?

Ask about licensing fees, per-location charges, integration fees, and upgrade pricing. Some platforms advertise low subscriptions but add charges for features that should be standard. Scannabar includes support, upgrades, and toll-free customer service 7 days a week at no extra charge.

How Quickly Can Staff Learn the System?

A system that requires days of training slows your rollout and increases labor costs. Scannabar's hand-held device is simple enough that staff can begin performing counts within a single shift.

In Conclusion: How to Choose Bar Inventory Software That Protects Your Margins

The real cost of bar inventory is not the software subscription. It is the money you lose every week that your current system fails to detect. Variance, heavy pours, missing bottles, and delayed counts create a cascade of hidden costs that compound across every bar and every location you operate.

Purpose-built bar inventory software with serialized bottle tracking, POS integration, and barcode-based counts closes the gap between what you think you are losing and what you are actually losing.

Scannabar delivers that level of control for independent bars, hotel properties, and multi-location groups. The track record speaks for itself: shrinkage reduced to 1% to 3%, beverage costs cut by 25% to 50% within weeks of implementation.

The question is not whether you can afford to invest in better liquor control. It is whether you can afford to keep making decisions with delayed inventory data.

FAQs About Bar Inventory Software

What is bar inventory software and why do hospitality operators need it?

Bar inventory software automates the process of counting, tracking, and analyzing your beverage stock. It replaces hand counts with barcode scanning and digital measurement, giving you accurate data on what you have, what you sold, and what went missing. Scannabar tracks every bottle individually from receiving to depletion, so operators catch variance within hours instead of weeks.

How does POS integration improve liquor inventory control?

POS integration compares what your register says you sold against what your physical inventory shows you actually poured. The difference is your variance, and it points directly to heavy pours, theft, or waste. Scannabar connects with POS platforms like Aloha, Micros, and InfoGenesis to create a closed-loop system that flags discrepancies automatically.

Can bar inventory software work across multiple hotel bars and banquet stations?

Yes. Purpose-built hospitality inventory systems handle multi-outlet properties by tracking bottles across fixed bars, portable bars, and event stations. Scannabar manages transfers between locations on a portable hand-held device, giving F&B directors centralized visibility into every outlet from one system.

How long does a full bar inventory count take with scanning technology?

With barcode-based scanning, a bar stocked with 80 to 120 bottles takes roughly 15 minutes to count. That speed allows operators to count after every shift or daily, catching variance far earlier than monthly hand-counts. Scannabar processes all calculations automatically during the scan, so reports are ready the moment you finish.

What should I look for when comparing bar inventory software pricing?

Look beyond the monthly subscription. Factor in labor savings from faster counts, revenue recovered through earlier variance detection, and hidden costs such as per-location charges, integration fees, and support contracts. Scannabar includes toll-free support, software upgrades, and ongoing service at no additional charge, with no recurring monthly or yearly licensing fees.

How does serialized bottle tracking differ from standard SKU-level inventory?

SKU-level tracking tells you how many bottles of a product you have on hand. Serialized tracking assigns a unique identity to each individual bottle and monitors its contents through every scan. Scannabar's serialized approach means you know exactly which bottle is missing and exactly where it was last recorded, giving you accountability at the individual bottle level.

Topics: liquor inventory, Bar inventory, Hotel Inventory, liquor inventory system, liquor inventory app, Hotel Bar Inventory, Cruise ship bar inventory, Country Club Liquor Inventory

Liquor Shrinkage Solutions Every Bar Owner Should Know

Discover proven strategies to reduce liquor loss and protect your bar's profits from the hidden threat that costs the industry billions annually.

Understanding the True Cost of Liquor Shrinkage in Your Bar

Liquor shrinkage represents one of the most insidious profit killers in the hospitality industry, costing bars and restaurants an estimated 20-25% of their total liquor inventory annually. This translates to billions of dollars in lost revenue across the industry, with individual establishments losing anywhere from $15,000 to over $100,000 per year depending on their size and volume. What makes this problem particularly dangerous is its invisibility—most bar owners don't realize the extent of their losses until they conduct a thorough audit or implement precise tracking systems.

The true cost extends far beyond the immediate value of lost inventory. When liquor disappears from your shelves through over-pouring, theft, or administrative errors, you're not just losing the wholesale cost of that bottle. You're losing the potential profit margin, which typically ranges from 200-400% in the bar industry. A $30 bottle of premium vodka that goes missing represents approximately $120-150 in lost revenue when you factor in the retail value of the drinks that could have been poured. Multiply this across dozens or hundreds of bottles annually, and the impact on your bottom line becomes staggering.Bartender Mixing Cocktail at Bustling Bar-1

Perhaps even more concerning is how liquor shrinkage masks other operational inefficiencies and creates a culture of accountability gaps. When losses are normalized or accepted as 'just part of the business,' it signals to staff that precision and responsibility aren't priorities. This mindset can permeate other areas of operations, affecting everything from food costs to labor efficiency. Understanding the full scope of liquor shrinkage—both financial and cultural—is the first step toward implementing effective solutions that protect your profitability and create a more disciplined operational environment.

Smart Inventory Management Systems That Stop Loss Before It Happens

Traditional inventory methods—clipboard counts conducted weekly or monthly—create massive blind spots where shrinkage can thrive undetected. By the time you discover discrepancies, the trail has gone cold, making it nearly impossible to identify when, how, or by whom the loss occurred. Modern inventory management systems flip this reactive approach on its head by implementing bottle-level tracking that monitors every pour in real-time. These systems use weight sensors, pour spouts with flow meters, or RFID technology to track precisely how much product leaves each bottle, comparing actual pours against POS transactions to instantly flag discrepancies.

The power of precise bottle-level tracking lies in its ability to create an unbroken chain of accountability. When every ounce is monitored, several common loss scenarios become immediately visible: over-pouring that exceeds recipe specifications, drinks poured without corresponding sales transactions, inventory that disappears during non-business hours, and systematic patterns that suggest targeted theft. This granular visibility transforms inventory management from a periodic audit into a continuous monitoring system that catches problems within hours rather than weeks. Bar owners using these systems report catching issues they never knew existed, from bartenders consistently pouring heavy handed drinks to after-hours access that was quietly draining high-value bottles.

Beyond detection, smart inventory systems provide predictive analytics that help prevent losses before they occur. By establishing baseline pour patterns and usage rates for each product, these systems can alert managers to anomalies that warrant investigation—a sudden spike in premium whiskey usage during a slow Tuesday shift, for example, or consumption rates that deviate from historical norms. This proactive approach allows you to address potential issues immediately rather than discovering them during your end-of-month inventory count when the damage has already been done. The most sophisticated systems even integrate with your POS and scheduling software to cross-reference sales data with staff schedules, pinpointing exactly which shifts and which employees correlate with loss patterns.

Staff Training and Accountability Measures That Actually Work

Technology alone cannot solve liquor shrinkage—the human element requires equal attention through comprehensive training and clear accountability structures. The foundation starts with proper bartender training on standardized recipes and pour techniques. Many bartenders develop their pouring style through trial and error or by mimicking other bartenders, leading to inconsistent measurements that can easily result in 25-30% over-pouring on every drink. Implementing mandatory training with jiggers or measured pour spouts, followed by regular testing to ensure accuracy, eliminates the excuse of unintentional over-pouring. When bartenders understand that a standard pour is exactly 1.5 ounces—not 'about' 1.5 ounces—and have the tools and practice to execute it consistently, one of the largest sources of shrinkage dramatically decreases.

Accountability measures must be both transparent and consistently enforced to be effective. Start by clearly communicating your shrinkage standards and expectations during onboarding, making it explicit that inventory accuracy is a core job responsibility. Implement individual bartender accountability by assigning specific stations or bottles and reconciling their inventory against their sales at the end of each shift. This real-time accountability, rather than collective responsibility for the entire bar's inventory, makes it impossible for losses to hide in the crowd. Display performance metrics visibly—some bars post pour accuracy percentages in the back of house, celebrating those who maintain precision while addressing those who consistently fall short. This transparency creates healthy peer pressure and makes inventory management a shared priority rather than solely a management concern.

The most successful accountability programs pair monitoring with positive reinforcement rather than relying solely on punitive measures. Consider implementing incentive programs that reward bartenders who maintain pour accuracy above 95% or shifts that end with zero discrepancies between inventory and sales. This carrot approach, combined with the stick of progressive discipline for repeated violations, creates motivation to maintain standards without fostering a hostile work environment. Regular refresher training sessions, particularly after any inventory discrepancies are discovered, demonstrate your commitment to education and improvement rather than mere punishment. When staff understand that accountability measures exist to protect the business that employs them—and that precision is both expected and rewarded—they become partners in shrinkage prevention rather than adversaries to be monitored.

Technology Solutions for Real-Time Pour Control and Monitoring

The technological revolution in pour control has introduced solutions that range from simple to sophisticated, allowing bars of any size to find systems that match their needs and budget. At the entry level, measured pour spouts replace standard spouts and physically limit each pour to a predetermined amount—typically 1 or 1.5 ounces—making over-pouring mechanically impossible. These inexpensive devices provide immediate shrinkage reduction, though they lack data collection capabilities and can't detect theft or drinks poured without sales. Mid-tier solutions include wireless pour spouts that communicate with software to track every pour's volume, timestamp, and the bottle it came from, creating a comprehensive data trail without requiring bartenders to change their workflow significantly.

Advanced systems integrate multiple technologies to create comprehensive monitoring ecosystems. Smart bottle systems use weight sensors on shelves that continuously monitor each bottle's weight, automatically detecting when product leaves the bottle and calculating the exact amount poured. These systems integrate directly with POS terminals to match each pour against corresponding sales transactions in real-time, triggering immediate alerts when discrepancies occur. Some platforms incorporate video surveillance that automatically records footage whenever a bottle is accessed, providing visual evidence that can be reviewed if irregularities are detected. The most cutting-edge solutions employ artificial intelligence to analyze patterns, learning what normal usage looks like for your specific establishment and flagging anomalies that human managers might miss in the flood of data.

The key to successful technology implementation lies in choosing systems that match your operational reality and ensuring proper integration with your existing infrastructure. A high-volume nightclub with twenty bartenders serving thousands of customers needs different solutions than an intimate cocktail bar with three staff members focusing on craft beverages. Consider factors like ease of use—systems that slow down service or require complex procedures won't be consistently used by staff—and the quality of reporting and analytics provided. The best technology translates raw data into actionable insights, highlighting which products have the highest loss rates, which shifts show anomalies, and providing trend analysis that helps you understand whether your shrinkage is improving or worsening over time. Implementation should include thorough staff training and a rollout period where you focus on education rather than enforcement, giving your team time to adapt to new workflows while you refine your systems and processes.

Creating a Culture of Transparency and Profit Protection

Sustainable shrinkage reduction requires more than systems and procedures—it demands a fundamental shift in your bar's culture toward transparency and shared responsibility for profitability. This cultural transformation starts at the top, with ownership and management openly discussing the reality of liquor loss, its impact on the business, and why addressing it matters for everyone's job security and earning potential. When staff understand that shrinkage directly affects whether the business can provide raises, invest in improvements, or even remain open, they're more likely to view prevention measures as protective rather than punitive. Share aggregate data about shrinkage rates and celebrate improvements collectively, making profit protection a team goal rather than a management obsession.

Transparency extends to your policies, procedures, and enforcement. Clearly document your expectations regarding pour accuracy, inventory procedures, and consequences for violations, making sure every staff member receives and acknowledges this information. Conduct regular audits and share results openly, explaining not just what was found but why it matters and what steps will be taken to address issues. When problems are discovered, address them promptly and consistently—selective enforcement breeds resentment and signals that rules don't actually matter. This consistency builds trust that the systems exist for legitimate business reasons rather than as tools for arbitrary discipline, encouraging staff cooperation rather than creative circumvention.

The ultimate goal is fostering a culture where everyone acts as a stakeholder in the business's financial health. This happens when bartenders take pride in their precision, when staff members feel comfortable reporting concerns about potential theft or policy violations, and when the entire team understands how their individual actions aggregate into collective success or failure. Consider implementing profit-sharing or bonus structures tied partially to shrinkage rates, giving staff direct financial incentive to maintain accuracy and prevent losses. Create regular forums where staff can provide feedback on inventory systems and suggest improvements, demonstrating that their input matters and that management is open to refinement. When your bar's culture evolves to treat every ounce of liquor as valuable and worth protecting, technology and procedures become enablers of existing values rather than external impositions fighting against the current. This cultural foundation makes all other shrinkage prevention measures exponentially more effective and sustainable over the long term.

Topics: Bar inventory, Hotel Inventory, Food Costs, Bar products, Increasing Profits, Loss prevention, Food Storage, Hotel Bar Inventory, Best Bar Inventory app, Cruise ship bar inventory, Country Club Liquor Inventory

Reducing Hospitality Waste with Scannabar Inventory Software

Discover how smart inventory management technology can slash waste by up to 30% while boosting your hospitality business's bottom line and sustainability goals.

The Hidden Cost of Inventory Waste in Hospitality Operations

In the competitive world of five-star hospitality, waste represents far more than discarded food or unused products—it's a silent profit killer that can significantly impact your bottom line. Industry studies reveal that hotels lose between 4-10% of their total inventory value to waste annually, translating to tens of thousands of dollars for luxury properties. From expired perishables in kitchen storage to overpouring at the bar, these losses compound daily, affecting not just profitability but also your property's sustainability credentials and brand reputation.

The challenge becomes even more complex when you consider the multiple revenue centers within a five-star hotel. Each restaurant, bar, banquet facility, and room service operation maintains its own inventory, creating silos where waste can hide in plain sight. Without accurate visibility into stock levels, expiration dates, and consumption patterns, even the most experienced managers struggle to identify where losses occur. Traditional manual counting methods are time-consuming, prone to human error, and often conducted too infrequently to catch problems before they become costly.

Beyond the direct financial impact, inventory waste carries hidden costs that affect operational efficiency. Staff hours spent on manual inventory counts, emergency orders placed at premium prices, and the reputational damage from running out of signature items during peak service all stem from inadequate inventory management. For five-star properties where guest expectations are highest, these operational hiccups can lead to negative reviews and lost repeat business—costs that far exceed the value of the wasted inventory itself.

How Real-Time Tracking Transforms Waste Management

Scannabar Inventory Software revolutionizes waste management by providing real-time visibility into every item across your hotel's operations. Using intuitive barcode scanning technology, staff can instantly update inventory levels as products are received, transferred between locations, or consumed. This immediate data capture eliminates the lag time between physical counts and system updates, giving managers an accurate, up-to-the-minute picture of what's in stock, where it's located, and how quickly it's moving. For five-star hotels managing hundreds or thousands of SKUs across multiple outlets, this level of precision is transformative.

The software's mobile capabilities mean that inventory management becomes seamless and integrated into daily workflows rather than a disruptive separate task. Bartenders can scan items as they're used, kitchen staff can update counts during prep work, and receiving teams can log new deliveries instantly—all from smartphones or tablets. This distributed approach to data collection not only improves accuracy but also creates a culture of accountability where every team member contributes to waste reduction. The real-time dashboard alerts managers to unusual variance, potential theft, or accelerating waste trends before they spiral out of control.

Perhaps most powerfully, real-time tracking enables proactive rather than reactive management. Instead of discovering expired products during weekly inventory counts, Scannabar's expiration date tracking flags items that need to be used soon, allowing chefs and bartenders to feature these products in specials or promotional offerings. The system can automatically generate alerts when stock is approaching its use-by date, transforming potential waste into revenue-generating opportunities. This shift from damage control to strategic planning represents a fundamental change in how five-star properties can manage their resources.

Preventing Spoilage and Overpouring with Data-Driven Insights

One of the most significant sources of waste in hotel operations is product spoilage, particularly for perishable items in kitchens and bars. Scannabar's advanced analytics provide detailed insights into product velocity, showing exactly how quickly each item moves through your inventory. This data-driven approach allows managers to identify slow-moving products before they expire and adjust purchasing quantities accordingly. For seasonal items or specialty ingredients, the software can track historical usage patterns, helping you forecast demand more accurately and order quantities that match actual consumption rather than hopeful projections.

The bar represents another critical area where Scannabar delivers measurable waste reduction. Overpouring costs hotels millions of dollars annually, and without precise measurement, even experienced bartenders can be inconsistent. Scannabar's variance reporting compares the amount of product that should have been used based on sales data against actual inventory depletion, immediately highlighting discrepancies. When variance exceeds acceptable thresholds, managers receive alerts and can investigate whether the cause is overpouring, spillage, theft, or incorrect recipes. This accountability mechanism naturally encourages more careful pour practices and standardization across bartending staff.

The software also enables sophisticated recipe costing and portion control that directly impacts waste. By programming standard recipes into Scannabar, hotels can track exactly how much of each ingredient should be used per dish or cocktail. The system then monitors actual usage against these standards, revealing when portions creep larger than intended or when ingredient waste occurs during preparation. For five-star properties where food costs already run higher due to premium ingredients, this level of control can mean the difference between a profitable menu and one that looks impressive but erodes margins. Many hotels report reducing food waste by 20-30% within the first six months of implementation simply by gaining this visibility.

Streamlining Ordering to Match Actual Demand

Traditional ordering processes in hospitality often rely on gut instinct, perpetual inventory systems that drift out of sync with reality, or overordering to ensure you never run out of key items. This approach inevitably leads to waste as inventory ages on shelves or exceeds storage capacity. Scannabar transforms ordering into a data-driven process by analyzing consumption patterns, seasonal trends, and upcoming events to generate intelligent purchase recommendations. The software calculates optimal reorder points and quantities for each product, ensuring you maintain adequate stock levels without excess that leads to spoilage or tied-up capital.

For five-star hotels with complex F&B operations, Scannabar's multi-location ordering capabilities provide unprecedented coordination. The system tracks inventory across all outlets and can suggest inter-location transfers before placing new orders, reducing redundant purchasing. If your lobby bar is overstocked on a particular spirit while your rooftop venue is running low, Scannabar identifies this opportunity to redistribute inventory internally. This coordination not only reduces waste but also minimizes the working capital tied up in inventory across the property, improving overall financial performance.

Integration with your suppliers takes efficiency even further. Scannabar can generate purchase orders directly from its analytics, which can be sent electronically to vendors, reducing administrative time and ordering errors. The software maintains historical pricing data, helping you negotiate better rates and identify unusual price increases. Some hotels use the system's forecasting capabilities to participate in volume purchasing programs or take advantage of supplier promotions only when they genuinely need the products—avoiding the trap of buying excess inventory simply because it's on sale. This disciplined approach to procurement ensures every order aligns with actual demand rather than speculation.

Measuring Success and ROI from Waste Reduction Initiatives

Implementing Scannabar Inventory Software provides five-star hotels with comprehensive metrics to quantify waste reduction and calculate return on investment. The system's reporting dashboard tracks key performance indicators including total waste value, waste as a percentage of purchases, variance by category, and trends over time. These metrics transform waste from an abstract concern into concrete numbers that can be benchmarked, targeted, and improved. Many properties establish baseline measurements during their first month with the software, then set quarterly goals for waste reduction, creating accountability and focus across the management team.

The financial impact typically manifests in multiple ways beyond just reduced spoilage. Hotels report significant cost savings from optimized ordering—purchasing less frequently at better prices, reducing emergency orders that carry premium costs, and negotiating better terms with suppliers based on accurate consumption data. Labor efficiency improves dramatically as well, with inventory counts that once required multiple staff members working for hours now completed by one person in a fraction of the time. These labor savings can be redirected to guest-facing service activities that enhance the five-star experience, creating a positive cycle where operational efficiency enables superior hospitality.

Most five-star properties implementing Scannabar see positive ROI within 6-12 months, with waste reduction percentages typically ranging from 15-35% depending on the baseline level of inventory control. A 200-room luxury hotel with annual F&B revenue of $5 million and a 30% cost of goods sold might waste $150,000 annually without proper controls. Reducing waste by even 20% represents $30,000 in annual savings—easily justifying the software investment while also advancing sustainability goals. Beyond the direct savings, the data-driven insights enable more strategic menu planning, pricing decisions, and operational improvements that compound benefits over time. For hospitality businesses where margins are constantly under pressure, Scannabar transforms inventory management from a necessary evil into a competitive advantage.

Topics: Hotel Inventory, Scannabar Inventory system, hotel supplies, hotel parties, Hotel Bar Inventory, Best Liquor Inventory app, Scannabar inventory app, Restaurant Inventory app, Scannabar Inventory Software

Top Foodie Spring Getaways for Sun, Flavor, and Festive Vibes

Discover the most mouthwatering spring destinations where culinary excellence meets sunshine, vibrant festivals, and unforgettable seasonal flavors.

Why Spring Is the Ultimate Season for Culinary Travel Adventures

Spring awakens more than just flowers and warm weather—it signals the arrival of some of the world's most exciting culinary experiences. As winter's dormancy gives way to renewed energy, destinations across the globe burst into life with fresh produce, outdoor dining, and food festivals that celebrate the season's bounty. The mild temperatures create perfect conditions for exploring farmers markets, enjoying alfresco meals, and discovering local flavors without the sweltering heat of summer or the unpredictable chill of winter.A picturesque coastal scene unfolds showcasing a vibrant Mediterranean town where pastelcolored buildings cascade down to a sparkling azure sea Sunlig

For food lovers, spring represents a unique window when ingredients are at their peak freshness and variety. Asparagus, artichokes, peas, strawberries, and countless other seasonal delicacies make their debut on restaurant menus, giving chefs the opportunity to showcase their creativity with vibrant, flavorful dishes. Many culinary destinations also host their signature food and wine festivals during spring months, taking advantage of pleasant weather to bring communities together in celebration of regional cuisines.

Beyond the food itself, spring travel offers practical advantages that enhance any foodie getaway. Crowds are typically smaller than peak summer months, meaning shorter waits at popular restaurants and more intimate experiences at local eateries. Prices for accommodations often remain reasonable, and the combination of sunshine and comfortable temperatures makes it easy to walk off those indulgent meals while exploring charming neighborhoods and coastal promenades. Whether you're seeking Mediterranean freshness, Asian street food excitement, or New World innovation, spring creates the ideal backdrop for unforgettable culinary adventures.

Sun-Kissed Mediterranean Escapes Where Fresh Ingredients Shine

The Mediterranean region truly comes alive in spring, offering food enthusiasts an unparalleled combination of sunshine, sea breezes, and ingredient-driven cuisine. In Sicily, Italy, the almond blossoms create a stunning backdrop as local trattorias begin serving dishes featuring wild fennel, fava beans, and the season's first tomatoes. The coastal town of Taormina provides breathtaking views alongside fresh pasta with sea urchin, grilled swordfish, and cannoli filled with sweet ricotta. Spring temperatures hover in the comfortable 60s and 70s Fahrenheit, perfect for exploring ancient ruins between meals and sipping Nero d'Avola wine on sun-drenched terraces.

Greece's island destinations offer another irresistible Mediterranean option for spring travelers. Crete, with its remarkable biodiversity and centuries-old culinary traditions, showcases dishes made with just-harvested greens, local cheeses, and olive oil from the previous fall's harvest. The island's tavernas serve grilled octopus, dakos salad with ripe tomatoes and mizithra cheese, and lamb dishes perfected over generations. Meanwhile, the mainland's Peloponnese region invites visitors to discover family-run wineries, sample kalamata olives at their source, and enjoy moussaka made according to grandmother's recipes.

Spain's coastal regions provide yet another dimension to Mediterranean spring dining. The Costa Brava, stretching north from Barcelona, combines Catalan culinary excellence with pristine beaches and hidden coves. Small fishing villages serve suquet de peix (fisherman's stew), grilled calcots with romesco sauce, and paella made with seasonal vegetables and seafood caught that morning. The region's cava producers open their cellars for tastings, while markets overflow with spring peas, artichokes, and strawberries. With average temperatures in the low 70s and plenty of sunshine, it's the ideal time to explore this gastronomic paradise before summer crowds arrive.

Festival-Fueled Destinations That Celebrate Spring Through Food

New Orleans, Louisiana transforms into a food lover's paradise each spring, hosting festivals that celebrate the city's unique Creole and Cajun heritage. The New Orleans Jazz & Heritage Festival, typically held in late April and early May, features not just world-class music but also an astounding array of local specialties from cochon de lait po'boys to crawfish Monica, alligator sausage, and mango freeze. The French Quarter Festival in mid-April offers free admission and showcases more than 60 food booths serving everything from classic beignets to innovative fusion dishes. Spring weather in NOLA is ideal—warm days around 75-80°F with lower humidity than summer months—making it comfortable to stroll through the French Quarter while sampling pralines and sipping Sazeracs.

Charleston, South Carolina's spring food scene rivals any destination in the country, particularly during the Charleston Wine + Food Festival held each March. This five-day celebration brings together renowned chefs, winemakers, and food artisans for cooking demonstrations, tastings, and special dinners throughout the historic city. Beyond the festival, Charleston's restaurant scene shines with Lowcountry classics like shrimp and grits, she-crab soup, and fresh oysters from local waters. The mild spring temperatures and blooming azaleas create a romantic atmosphere for dining on historic piazzas and exploring the city's culinary heritage that spans centuries.

Across the Pacific, Tokyo's spring season centers around hanami (cherry blossom viewing), which coincides with exceptional seasonal eating experiences. Food stalls pop up in parks during cherry blossom season, serving special hanami bento boxes, sakura-flavored treats, and seasonal sake. The city's depachika (department store food halls) overflow with spring delicacies including bamboo shoots, mountain vegetables, and the prized sakura shrimp. Spring also marks the beginning of warmer weather dining at Tokyo's countless outdoor food markets and street food vendors, where you can sample everything from takoyaki to seasonal tempura. With temperatures ranging from the mid-50s to low 70s, it's the perfect time to explore Tokyo's diverse neighborhoods and their distinct culinary offerings.

Hidden Gem Coastal Towns Serving Seasonal Seafood Perfection

Essaouira, Morocco offers an enchanting blend of Atlantic breezes, vibrant culture, and some of North Africa's freshest seafood. This whitewashed coastal town, less crowded than Marrakech but equally captivating, features a working fishing port where boats arrive each morning with the day's catch. Visitors can select fish, sardines, or shellfish directly from the port's market stalls, then have them grilled on the spot with Moroccan spices, olive oil, and lemon. The town's restaurants serve incredible seafood tagines, grilled prawns with chermoula sauce, and fish couscous that showcases the region's culinary fusion of Berber, Arab, and French influences. Spring temperatures hover in the comfortable 60s to low 70s, with coastal winds keeping everything fresh and pleasant.

Polperro, Cornwall in England provides a quintessentially charming fishing village experience with outstanding seafood and traditional British hospitality. This tiny harbor town, accessible only by foot through narrow streets, has maintained its authentic character while developing a reputation for excellent restaurants serving locally caught crab, lobster, mackerel, and monkfish. Spring in Cornwall means fewer tourists, wildflowers covering the coastal paths, and comfortable temperatures for hiking the dramatic cliffs before settling into a cozy pub for fish and chips or a sophisticated seafood tasting menu. The local waters produce exceptional oysters, and many establishments pair their seafood with wines from Cornwall's emerging viticulture scene.

Comporta, Portugal remains relatively undiscovered compared to the Algarve, making it an ideal destination for travelers seeking authentic Portuguese coastal cuisine without the crowds. Located south of Lisbon, this laid-back beach town offers miles of pristine coastline, rice paddies, and pine forests, along with restaurants specializing in arroz de marisco (seafood rice), grilled sea bass, clams with garlic and coriander, and percebes (goose barnacles) harvested from nearby rocks. Spring brings perfect beach weather—warm enough for swimming but not scorching—and the chance to enjoy outdoor dining at beachfront chiringuitos while watching spectacular sunsets. The region's wines, particularly from the nearby Setúbal Peninsula, complement the seafood perfectly, making every meal a celebration of Portuguese coastal living.

Planning Your Perfect Spring Foodie Getaway Experience

Successful culinary travel requires thoughtful planning to maximize your gastronomic experiences while maintaining flexibility for spontaneous discoveries. Start by researching your destination's seasonal specialties and signature dishes—spring menus often feature limited-time ingredients that won't be available during other seasons. Make reservations at highly-rated restaurants well in advance, particularly for destinations hosting popular food festivals or events. However, leave room in your itinerary for unplanned meals at local recommendations, market discoveries, and casual eateries that capture authentic regional flavors. Consider booking accommodations in neighborhoods known for food scenes rather than tourist-heavy areas, giving you immediate access to where locals actually eat.

Timing your trip strategically can dramatically enhance your experience and value. Shoulder season travel during early spring (March-April) or late spring (May) often provides the best combination of pleasant weather, fewer crowds, and reasonable prices. Check local event calendars for food festivals, farmers markets, and culinary events that align with your travel dates. Many destinations offer food tours, cooking classes, and market visits that provide insider knowledge and hands-on experiences—these activities work especially well early in your trip, giving you context and recommendations for the rest of your stay. Don't forget to research any seasonal closures, as some restaurants in tourist areas may have limited hours during shoulder seasons.

Packing and preparation considerations for a foodie getaway differ from standard travel planning. Bring comfortable walking shoes suitable for exploring food markets and neighborhoods on foot—you'll likely walk much more than anticipated between meals and attractions. Consider packing elastic-waist clothing or looser fits to stay comfortable during multi-course meals and frequent tastings. Download translation apps, research dietary restrictions or allergies in the local language, and familiarize yourself with tipping customs and dining etiquette. Finally, embrace the mindset of culinary adventure: be willing to try unfamiliar ingredients, eat where locals eat, and understand that the best food experiences often happen in unexpected places. Your spring foodie getaway should balance planned experiences with spontaneous discoveries, creating memories that engage all your senses.

Topics: Bar trends, Bar drinks, Classic drinks, drink recipe, Bloddy Mary, banquet events, bar inventory app, Hotel Bar Inventory, Tequila brands, Spring Break

Reducing Hotel Bar Waste to Boost Profitability at Tropical Resorts

Unlock hidden profits at your tropical resort by transforming bar waste into sustainable savings and unforgettable guest experiences.

A vibrant hotel bar scene set in a tropical resort with lush green palm trees visible through large open windows The bar is elegantly designed featuriThe Hidden Costs of Bar Waste in Tropical Resorts

Bar waste is often an overlooked expense that can significantly impact a tropical resort’s bottom line. Spoiled mixers, half-used fruit garnishes, over-poured spirits, and unsold cocktails add up quickly, especially in all-inclusive operations where guests expect generous offerings. These hidden costs not only reduce profit margins but can also contribute to higher purchasing and disposal expenses.

With fluctuating occupancy and unpredictable guest preferences, bars in tropical resorts face unique challenges in inventory management. Inefficient practices can lead to unnecessary surplus, spoilage, and ultimately, waste. By identifying and addressing these hidden costs, resorts can take the first step toward more efficient, sustainable operations.

Sustainable Strategies for Reducing Beverage Waste

Implementing smart inventory control systems is essential to monitor and manage beverage usage in real time. Digital inventory solutions can help track popular drinks, predict demand, and automate reordering, reducing both shortages and excess stock. Additionally, adopting standardized pour sizes and training bartenders to follow recipes can eliminate over-pouring and ensure consistency.

Resorts can also consider smaller batch preparation for fresh ingredients and regularly review the bar menu to remove underperforming items. These simple yet effective strategies can help minimize waste, save money, and support a more sustainable operation.

Creative Reuse: Turning Bar Leftovers into Profit

Instead of discarding unsold ingredients or leftover garnishes, innovative resorts are finding creative ways to repurpose bar waste. Citrus peels, for instance, can be transformed into house-made syrups, infusions, or cocktail garnishes. Overripe fruits can be used in smoothies, desserts, or even as natural flavorings for spa treatments.

By giving new life to what would otherwise be waste, resorts not only cut costs but also create signature offerings that set them apart. These creative reuse practices can boost profitability and support a compelling sustainability story for guests.

Empowering Staff to Champion Waste Reduction

Staff engagement is crucial to the success of any waste reduction initiative. Training bartenders and barbacks on efficient ingredient usage, proper storage, and accurate inventory tracking empowers them to take ownership of the process. Recognizing and rewarding staff who contribute innovative waste-reducing ideas helps cultivate a culture of accountability and continuous improvement.

Open communication between management and staff ensures that everyone understands the goals and benefits of reducing bar waste. When team members feel invested in sustainability efforts, they are more likely to identify new opportunities for savings and efficiency.

Enhancing Guest Satisfaction Through Eco-Friendly Practices

Today’s travelers increasingly value eco-friendly practices and are drawn to hotels that demonstrate environmental responsibility. By promoting waste reduction initiatives, tropical resorts can appeal to this growing demographic, enhancing their brand reputation and guest loyalty.

Offering signature cocktails made from reused ingredients or sharing stories about sustainable bar practices can enrich the guest experience. These efforts not only help the environment and reduce costs but also create memorable, feel-good moments that inspire guests to share their positive experiences with others.

Topics: Bar inventory, Hotel Inventory, hotel supplies, inventory control, Hotel Bar Inventory, Best Bar Inventory app, Best Liquor Inventory app, Cruise ship bar inventory, Country Club Liquor Inventory

Effective Restaurant Waste Management to Lower Operational Costs

Discover how strategic waste management can transform restaurant operations, cut costs, and boost sustainability in the hospitality industry.

Why Restaurant Waste Management Matters for Your Bottom Line

A sleek restaurant bar with polished wooden surfaces reflects warm ambient lighting Behind the bar an array of colorful liquor bottles is neatly organ-1As a food and beverage manager, I’ve seen firsthand how waste management directly affects a hotel’s profitability. Unchecked waste doesn’t just impact the environment—it eats into margins through higher disposal fees, unnecessary purchasing, and labor inefficiencies. By prioritizing waste reduction, we not only decrease costs but also improve our sustainability credentials, which increasingly matters to guests and stakeholders.

Being proactive about waste management ensures our resources are used more efficiently, allowing us to invest savings into staff development, quality improvements, or guest experiences. It’s a win-win for the bottom line and brand reputation.

Identifying Key Sources of Waste in Restaurant Operations

The first step in tackling waste is identifying where it occurs most. In hotel bars and restaurants, food spoilage, overproduction, inefficient inventory management, and excessive packaging are common culprits. Energy waste from outdated equipment and improper use is another significant cost driver.

By conducting regular waste audits and involving kitchen, bar, and service teams in reporting, we gain a clear picture of problem areas. This foundational knowledge is critical for targeting improvements and measuring progress.

Smart Strategies to Minimize Food, Packaging, and Energy Waste

Implementing portion control, batch cooking, and first-in, first-out (FIFO) inventory systems significantly reduces food waste. Training staff to use ingredients creatively—such as repurposing trim or surplus—is another effective tactic. We’ve also re-evaluated our menu design to minimize perishable items and standardized order quantities to prevent overstocking.

Switching to eco-friendly packaging, consolidating deliveries, and upgrading to energy-efficient appliances have further minimized our environmental impact and operating costs. Setting clear waste reduction goals and tracking performance keeps everyone motivated.

Leveraging Technology for Efficient Waste Tracking and Reduction

Technology has been a game-changer for us. Implementing Scannabar’s inventory and waste management software has streamlined our daily procedures. With automated stocktaking, real-time tracking, and analytics, we quickly spot discrepancies and adjust purchasing accordingly. This has drastically cut down on over-ordering and stock losses.

Scannabar also provides actionable insights into usage patterns, allowing us to optimize menu engineering and reduce both food and beverage waste. The time saved on manual processes means our team can focus more on guest service and less on paperwork.

Building a Culture of Sustainability Among Staff and Customers

Sustainable waste management isn’t a one-person job—it requires buy-in from the entire team. We’ve made sustainability part of our training, encouraging staff to suggest improvements and rewarding innovative ideas. Regular communication ensures everyone understands their role and the impact of their actions.

Guests are also part of our sustainability journey. By highlighting our efforts—such as waste reduction initiatives and eco-friendly practices—we foster loyalty and differentiate our hotel in a competitive market. Transparency and engagement build a positive culture that extends from our team to our customers.

Topics: Hotel Inventory, Food Costs, hotel supplies, Food control, liquor inventory app, Hotel Bar Inventory, Best Bar Inventory app, Best Liquor Inventory app, Scannabar inventory app

Optimizing Hotel Beverage Analytics with Inventory Control Apps

Unlock the full potential of your hotel's beverage program by integrating powerful inventory control apps that transform data into actionable insights.

Transforming Beverage Operations Through Data-Driven Insights

The hospitality industry is rapidly embracing data-driven approaches to streamline operations and enhance the guest experience.The image showcases a sleek modern bar environment filled with various bottles of liquor neatly arranged on shelves behind the counter A staff member dressed in a crisp white shirt and black apron is seen scanning a bottle with a handheld device high-1 For hotel purchasers and beverage managers, leveraging data analytics through inventory control apps can revolutionize how beverage programs are managed. These apps gather and process vast amounts of information, translating raw numbers into actionable insights that inform purchasing decisions, identify sales trends, and reveal underperforming products.


By converting traditional guesswork into informed strategies, data-driven insights enable hotels to optimize their beverage selections, tailor offerings to guest preferences, and respond quickly to market changes. This shift not only improves operational efficiency but also boosts revenue and guest satisfaction.

Key Features of Leading Inventory Control Apps for Hotels

Not all inventory control apps are created equal. The best solutions for hotels come equipped with features specifically tailored to the unique demands of hospitality beverage management. Look for apps that offer real-time inventory tracking, automated ordering, and detailed analytics dashboards. These features help hotel purchasers maintain optimal stock levels and reduce manual labor.

Additionally, integration with point-of-sale (POS) systems, compatibility with mobile devices, and customizable reporting are essential. Robust security protocols and user-friendly interfaces ensure that staff at all levels can seamlessly adopt and benefit from the technology.

Reducing Waste and Maximizing Profitability with Real-Time Analytics

One of the most significant advantages of using inventory control apps is the ability to monitor inventory in real time. This immediate visibility helps hotel purchasers quickly identify discrepancies, track usage patterns, and prevent both overstocking and stockouts. By reducing excess inventory and minimizing expired or unused products, hotels can dramatically cut waste.

Real-time analytics also highlight high-margin and high-demand products, allowing purchasers to make data-backed decisions that drive profitability. As a result, hotels can refine their beverage offerings, negotiate better supplier terms, and achieve a healthier bottom line.

Integrating Inventory Control Apps with Existing Hotel Systems

To unlock the full value of inventory control apps, seamless integration with existing hotel management systems is crucial. When these apps connect with property management systems (PMS), POS platforms, and accounting software, data flows effortlessly across the organization. This integration eliminates data silos, reduces manual entry errors, and provides a holistic view of hotel operations.

A successful integration ensures that purchasing, sales, and inventory information is centralized and accessible, empowering teams to collaborate more effectively. It also enables hotels to automate complex processes, such as invoicing and supplier management, streamlining workflows and saving valuable time.

Future Trends: How AI and Machine Learning Are Shaping Beverage Analytics

Artificial intelligence (AI) and machine learning are poised to further transform hotel beverage analytics. Advanced inventory control apps are beginning to harness these technologies to predict demand, optimize ordering schedules, and personalize beverage recommendations based on guest profiles and historical data.

Looking ahead, we can expect even greater automation, smarter forecasting, and deeper insights as AI and machine learning continue to evolve. By staying ahead of these trends, hotel purchasers can ensure their beverage programs remain competitive, agile, and highly profitable.

Topics: Hotel Inventory, hotel supplies, liquor inventory app, Hotel Bar Inventory, Best Liquor Inventory app, wine inventory app, Scannabar inventory app